Gold Price Forecast: Bearish momentum building up on Fed day?
- Gold price remains on the back foot, as Fed day arrives.
- Fed to continue its flight to curb inflation, despite a looming recession.
- XAU/USD is forming lower highs on the 4H chart, as RSI flips bearish.

Gold price is trading listlessly amid a tepid market mood on Fed day so far, holding the lower ground of this week’s trading range. Markets remain on a cautious footing ahead of the all-important Fed rate decision and planned Xi-Biden talks. However, resilient earnings from the US tech titans, Alphabet Inc. and Microsoft Inc. offer a sliver of hope to investors but they refrain from committing any directional path on the bullion, anticipating a 75 bps Fed rate hike. The yellow metal is expected to witness choppy trading while within a defined range in the lead-up to the Fed showdown. The renewed uptick in the US Treasury yields is negated by the drop in the dollar, leaving gold price more or less flatlined above the $1,700 mark.
Recession fears continue to lurk amid the European gas crisis, China’s covid concerns and aggressive central banks’ tightening. Although Fed Chair Jerome Powell is unlikely to be dissuaded by the growth fears, as he will likely stick with his pledge to tame inflation at the July meeting. Therefore, the downside appears more compelling for the non-interest-bearing precious metal. Only a message on a slowdown in the Fed’s tightening path for September and beyond and/ or any hints on inflation peaking could be read as dovish and may offer the much-needed lift to gold price.
Also read: Fed Preview: Dollar’s fate hinges on Powell’s policy guidance
XAU/USD price witnessed good two-way businesses on Tuesday but eventually settled in the red zone amid a sharp rebound in the US Treasury yields from multi-week troughs. Risk-off flows remained in vogue, as the European gas crisis worsened and rang recession bells after Russia’s Nord Stream 1 pipeline was expected to operate just at 20% capacity from Wednesday. The International Monetary Fund (IMF) slashed the growth forecasts for the next 18 months after warning that the world’s three biggest economies are all stalling, per The Guardian. Investors also refrained from putting their capital into riskier assets ahead of US techs results and the Fed event.
Gold price technical outlook: Four-hour chart
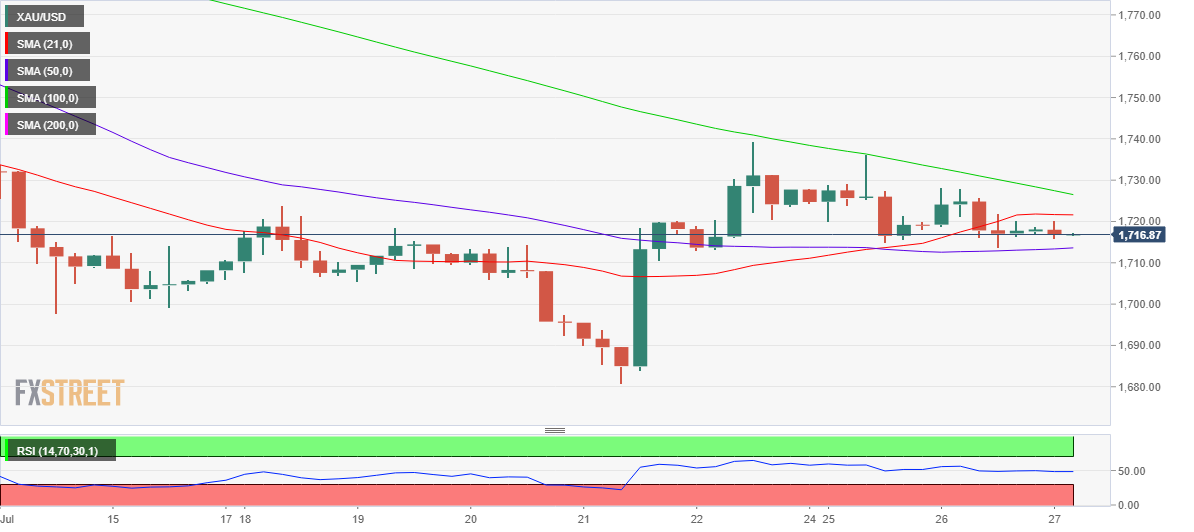
Multiple rejections at the bearish 100-Simple Moving Average (SMA), now at $1,727 on the four-hour chart, proved too costly for gold bulls. The metal, therefore, surrendered the horizontal 21 SMA at $1,722.
The Relative Strength Index (RSI) has peeped into the bearish territory, currently at 48.78, suggesting that the downside bias will likely remain intact.
The immediate support is placed at the horizontal 50 SMA of $1,714, below which the $1,700 could be challenged once again.
On a hawkish Fed rate, bears could attack the 16-month troughs of 1,681.
Alternatively, acceptance above 100 SMA will call for a test of the $1,750 psychological level, above which the horizontal trendline resistance at $1,752 will come into play.
Premium
You have reached your limit of 3 free articles for this month.
Start your subscription and get access to all our original articles.
Author

Dhwani Mehta
FXStreet
Residing in Mumbai (India), Dhwani is a Senior Analyst and Manager of the Asian session at FXStreet. She has over 10 years of experience in analyzing and covering the global financial markets, with specialization in Forex and commodities markets.


