Gold Price Forecast: $1,815 remains a tough nut to crack for XAU/USD bulls despite inflation fears
- Gold price recovery stalls once again, as a risk-off mood lifts the USD demand.
- The US Treasury yields retreat despite solid NFP, as inflation concerns resurface.
- Acceptance above $1,815-$1817 is critical to extending the gold price rebound.

After bearing the brunt from the hawkish policy announcements from the BOE and the ECB on ‘Super Thursday’, gold price witnessed good two-way price movements on Friday. The bright metal ended the day in green at $1,808, having dipped to $1,792 from the highs of $1,815, in an initial reaction to the US Nonfarm Payrolls (NFP) blowout. The American economy added 467K jobs in January vs. +150K expectations and +503K previous. Solid US jobs report revived the dollar bulls at gold’s expense, as it backed the calls for aggressive and faster Fed’s tightening this year. This dampened the mood on Wall Street, which helped gold price recover some ground heading into the weekly close.
Gold price is consolidating Friday’s turnaround below $1,815, as of writing, with the upside capped by the extended rebound in the greenback on a risk-off market profile. Discouraging Chinese Caixin Services PMI, looming tensions between the US and Russia over the Ukraine crisis and American-Sino trade headlines weighed on the Asian indices, barring China stocks, which jumped on a catch-up trade following a week-long holiday season. Meanwhile, investors continue to fret over soaring price pressures globally heading towards this week’s US inflation report, underpinning gold’s appeal as inflation-hedge while weighing heavy on the Treasury yields. Looking ahead, the Fed-driven sentiment and the price action in the yields, as well as the dollar will continue to remain the key drivers behind’s gold trade this week.
Gold Price Chart - Technical outlook
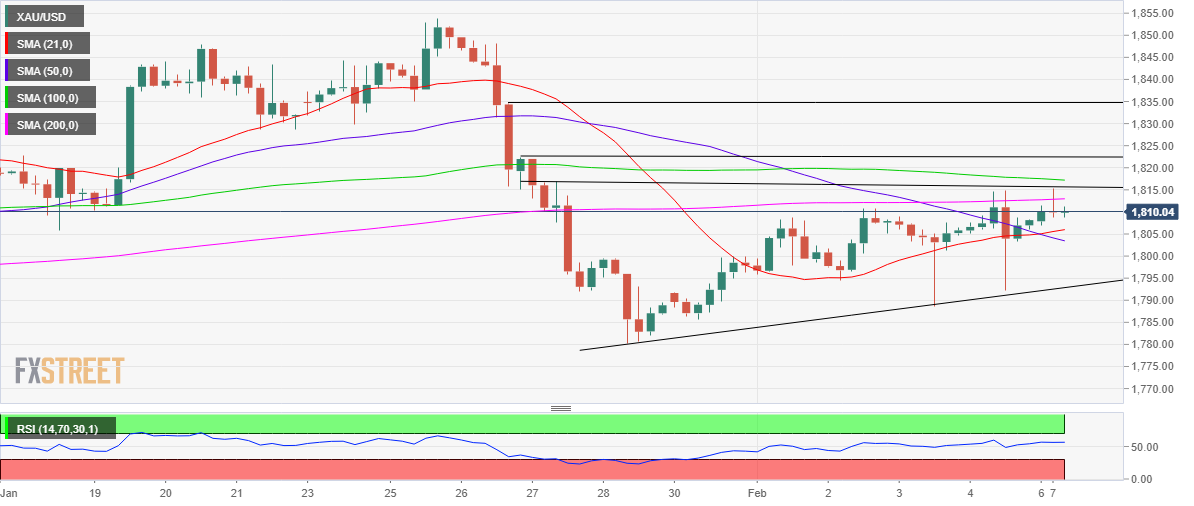
Gold: Four-hour chart
Gold price has carved out an ascending triangle formation on the four-hour sticks after forming higher lows since the January 28 meltdown.
However, bulls yearn for acceptance above the horizontal trendline resistance at $1,815 to confirm an upside breakout from the triangle.
The immediate barrier is seen at the bearish 100-Simple Moving Average (DMA) at $1,817, above which doors will open up towards $1,820.
A fresh upswing will be initiated above the latter, calling for a test of the $1,835 supply zone.
The Relative Strength Index (RSI) is inching lower but holds comfortably above the midline, keeping the bullish potential intact in the near term.
On the flip side, bullish 21-SMA will likely cap the further declines at $1,806. The next stop for bears is placed at $1,803, the downward-pointing 50-SMA.
Further south, the falling trendline support at $1,793 will be the last line of defense for gold buyers.
Premium
You have reached your limit of 3 free articles for this month.
Start your subscription and get access to all our original articles.
Author

Dhwani Mehta
FXStreet
Residing in Mumbai (India), Dhwani is a Senior Analyst and Manager of the Asian session at FXStreet. She has over 10 years of experience in analyzing and covering the global financial markets, with specialization in Forex and commodities markets.


