|

Gold price analysis: Gold is sideways waiting for Nonfarm Payrolls

This week, FED - the US Federal Reserve notified that the QE (quantitative easing) will be reduced slowly from November till June 2022. The chairman of FED, Jerome Powell also declared that 15 billion dollars will be withdrawn every month. Importantly, Bitcoin is rising as a new king of the safe-heaven in the new decade, which pushes gold to the second choice for saving assets.

Going against gold, the DXY - US Dollar Index climbs up significantly these days because of the new positive policy of the FED.

Today, the US Bureau of Labor Statistics will release Non-farm Payrolls which will have an important effect on the USD, especially gold.

Moving average analysis

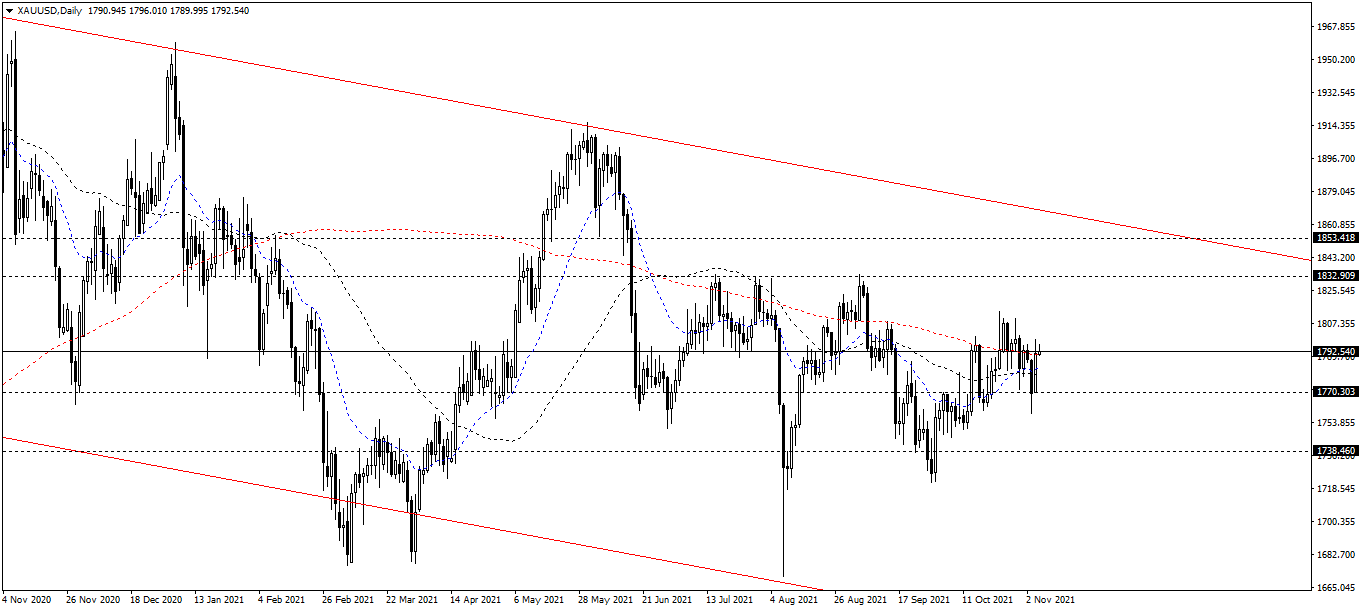
On the daily chart, the MA20/MA50 have reverse signals, however, it is not enough for the bulls to hold the game. The MA20/MA50 are still above the MA200. Eventually, the bears is coming back.

XAU/USD The daily chart

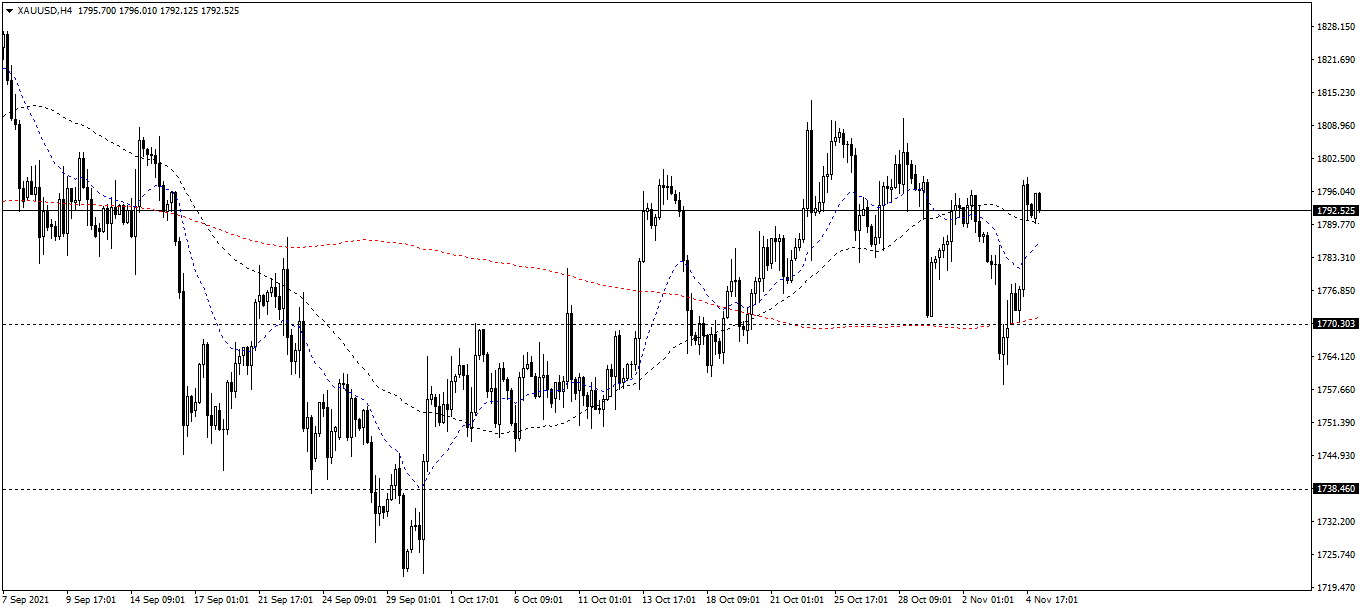
On the 4-hour chart, both the two MA20/MA50 climbed up, making a significant uptrend. The MA20 is below the MA50 showing that there may be a chance gold will fall down at the weekend.

XAU/USD The 4-hour chart

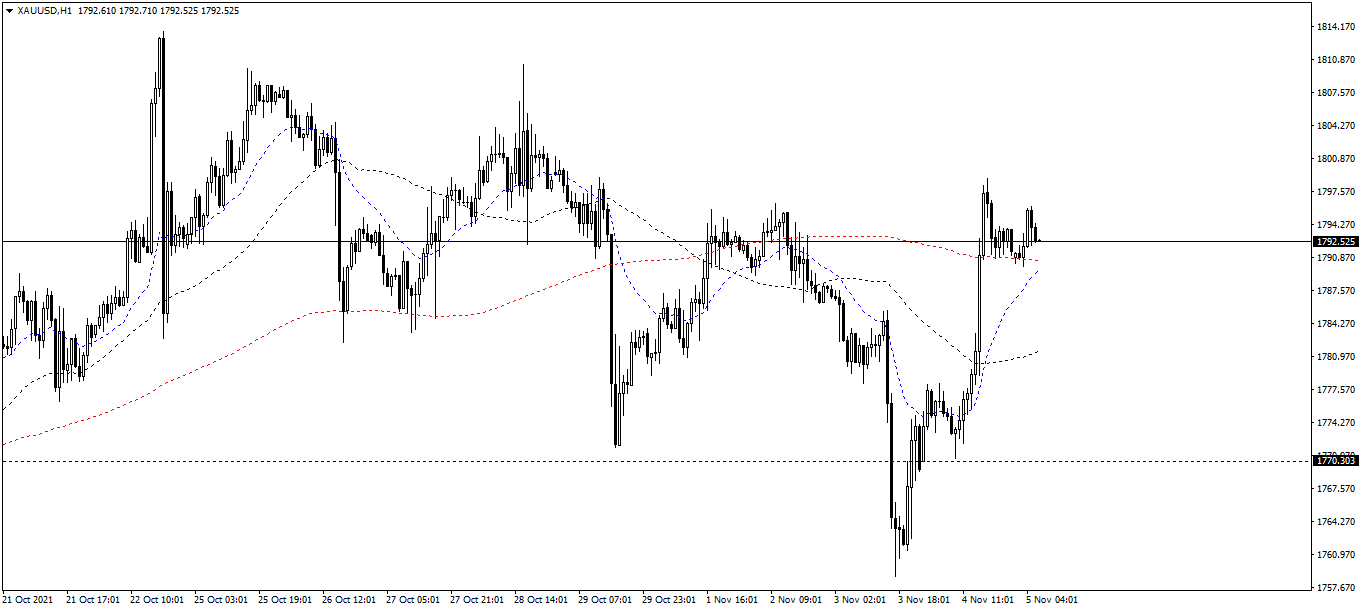
On the 1-hour chart, the MA200 crossed over the MA20/MA50 and made a significant diversification over the MA50. But, be careful about the climbing of the MA20 which reaches the peak of MA200 right now.

XAU/USD The 1-hour chart

In conclusion, in the long-term, gold might fall down. In the mid-term and the short-term, the bulls is dominating.

Fibonacci analysis

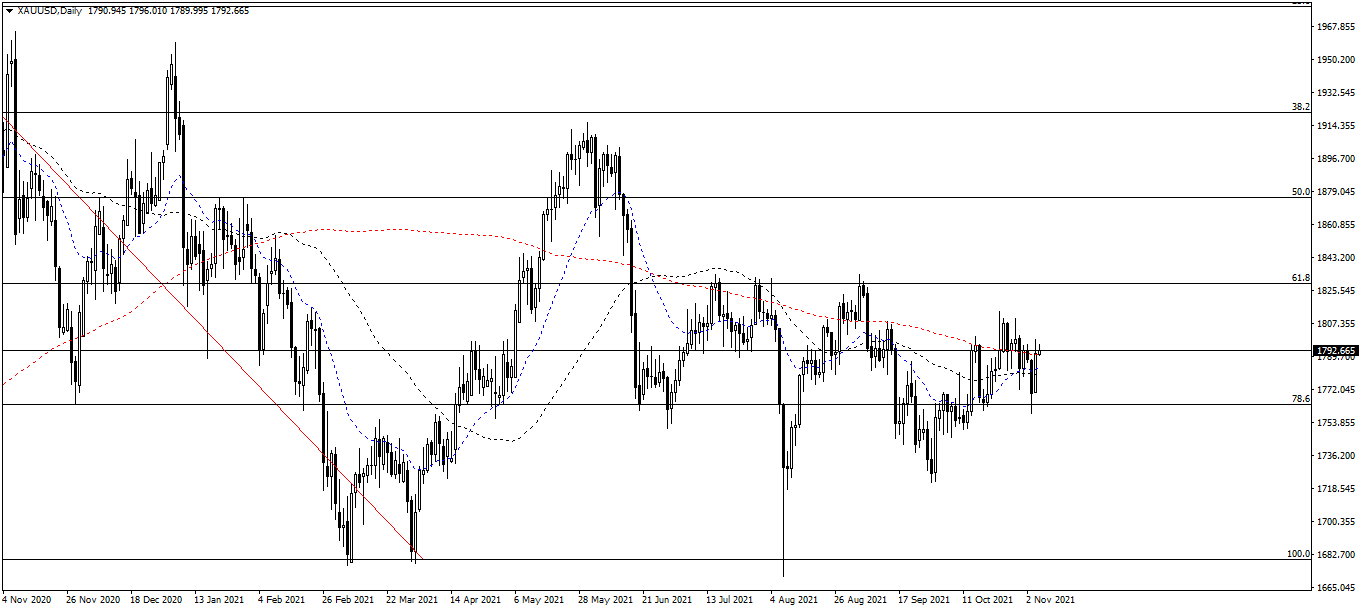
The Fibonacci indicator is measured on the daily chart at 2 levels:

The $1920/oz: This is a double top pattern, which is made in the last 6 months.

The $1680/oz: The strongest support in the past 2 years.

Gold is accumulating at the zone between $1770/oz and $1830/oz, considered as the Fibonacci 61.8 and 78.6. Keep an eye on the Fibonacci 78.6, this is the short-term goal for the bears this week if they want to make a significant impact.

XAU/USD The Fibonacci analysis chart

Support/resistance analysis

The resistances are $1800/oz and $1830/oz.

The supports are $1760/oz and $1740/oz.

Author

Thang Le

Thang Le

Independent Analyst

Thang Le is founder and owner of PSK - a financial community in Vietnam which at: Advising on strategic investment for individuals; Supporting the development of the investment community. He is Financial Analyst at Lion Group Hol

More from Thang Le
Share:

Editor's Picks

EUR/USD tests nine-day EMA support near 1.1850

EUR/USD inches lower during the Asian hours on Monday, trading around 1.1870 at the time of writing. The 14-day Relative Strength Index momentum indicator at 56 stays above the midline, confirming improving momentum. RSI has cooled from prior overbought readings but stabilizes above 50, suggesting dips could stay limited before buyers reassert control.

GBP/USD flat lines as traders await key UK macro data and FOMC minutes

The GBP/USD pair kicks off a new week on a subdued note and oscillates in a narrow range, just below mid-1.3600s, during the Asian session. Moreover, the mixed fundamental backdrop warrants some caution for aggressive traders as the market focus now shifts to this week's important releases from the UK and the US.

Gold buyers hesitate amid holiday-thinned trading

Gold trades volatile, but within range, as US, China holidays-led thin trading exaggerates moves. The US Dollar extends range play into the US GDP week, with markets pricing at least two Fed rate cuts this year. Technically, Gold tests key support at $5,000; daily RSI still remains bullish.

Top Crypto Losers: Dogecoin, Zcash, Bonk – Meme and Privacy coins under pressure

Meme coins such as Dogecoin and Bonk, alongside the privacy coin Zcash (ZEC), are leading the broader market losses over the last 24 hours. DOGE, ZEC, and BONK ended their three consecutive days of recovery with a sudden decline on Sunday, as crucial resistance levels capped the gains. Technically, the altcoins show downside risk, starting the week under pressure.

Global inflation watch: Signs of cooling services inflation

Realized inflation landed close to expectations in January, as negative base effects weighed on the annual rates. Remaining sticky inflation is largely explained by services, while tariff-driven goods inflation remains limited even in the US.

Ripple Price Forecast: XRP potential bottom could be in sight

Ripple edges up above the intraday low of $1.35 at the time of writing on Friday amid mixed price actions across the crypto market. The remittance token failed to hold support at $1.40 the previous day, reflecting risk-off sentiment amid a decline in retail and institutional sentiment.