Gold outlook: Trump’s tariff ambitions

Gold’s price appears to be moving in a relatively sideways fashion. In today’s report, we intend to have a look at the implications of Trump’s tariff policies, whilst discussing last week’s jobs report. For a rounder view, we conclude the report with a technical analysis of gold’s daily chart.
Trump’s economic policies
President-elect Trump’s inauguration date is set to occur in 6 days on the 20th of January 2025. President-elect Trump’s economic policies are beginning to take shape and in particular, his tariff plans which do not appear to have spared either friend or foe, as seen by the President-elect’s comments to impose a 25% tariff on imports from Canada. The incoming US administration could potentially use the International Emergency Economic Powers Act, which would allow the new administration to implement tariffs on day one by citing an unusual and extraordinary threat and declaring a national emergency. The proposed Trump tariffs have sparked widespread concern about a resurgence of inflationary pressures in the US economy, and thus with the date of his inauguration rapidly approaching, gold’s appeal may have increased given its status as a hedge against inflation. In conclusion, we would not be surprised to see gold’s appeal increasing to investors as the new administration takes over and tariff rhetoric potentially turns into legislation. However, should Trump’s tariff ambitions be scaled back, it may have the opposite effect and thus could weigh on gold prices. The aforementioned scenario appears to be in play, with Bloomberg reporting that Trump’s team is exploring gradual tariff hikes, in a bid to avoid a spike in inflation. However, the plan has not been presented to Trump per the same report.
US employment report comes in hotter than expected
This past Friday, the US employment data for December was released. The Non-Farm Payrolls figure was expected to drop to 154k yet exceeded expectations by coming in at 256k. Moreover, the unemployment rate was also expected to remain unchanged at 4.2% yet came in 4.1%. Overall, the US employment data has been described as a blowout jobs report, which showcased the resiliency of the US Labour market. The stronger-than-expected employment data, appears to have intensified expectations by market participants that the Fed may keep rates higher for longer, with Fed Fund Futures currently implying one rate cut in September for the year. Thus, given the assumed inverse relationship between gold and the dollar, the release may have temporarily weighed on gold’s price in spite of the aforementioned relationship being relatively inactive the past week or so. Hence attention may turn to the release of the US CPI rates on Wednesday which are expected to accelerate from 3.4% to 3.7%, implying persistent inflationary pressures in the US economy. Therefore, in theory, an acceleration of inflationary pressures in the US economy could intensify calls for the Fed to remain on hold for a prolonged period of time, which may be seen as bullish for the greenback and thus could weigh on the precious metal’s price. On the flip side a lower-than-expected inflation print, could have the opposite effect.
Technical analysis
XAU/USD daily chart
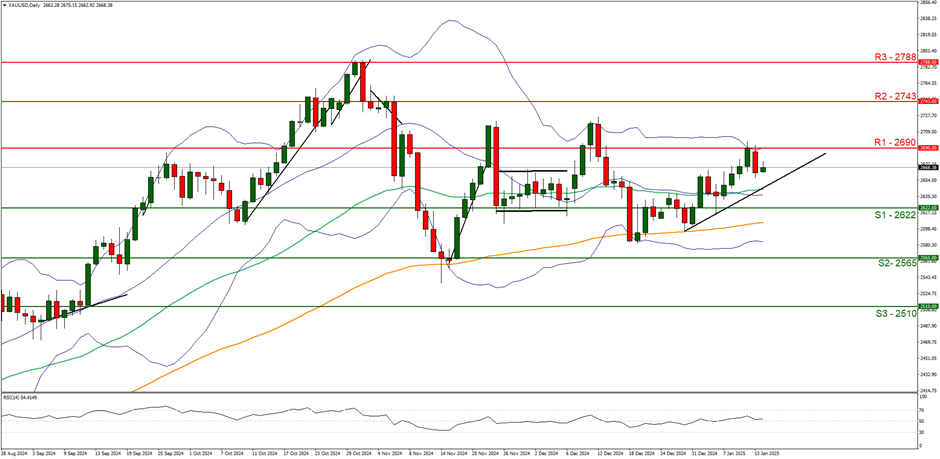
Support: 2622 (S1), 2565 (S2), 2510 (S3).
Resistance: 2690 (R1), 2743 (R2), 2788 (R3).
On a technical level, gold’s price appears to be moving in a sideways fashion, with the precious metal’s price facing resistance near our 2690 (R1) level. We cautiously opt for a sideways bias and supporting our case is the RSI indicator below our chart which currently registers a figure near 50, implying a neutral market sentiment. Yet, we would also like to note the upwards moving trendline which was incepted on the 30th of December 2024. Nonetheless, for our sideways bias to continue we would require the precious metal’s price to remain confined between the 2622 (S1) support level and the 2690 (R1) resistance line. On the flip side, for a bullish outlook, we would require a clear break above our 2690 (R1) resistance line, with the next possible target for the bulls being the 2743 (R2) resistance level. Lastly, for a bearish outlook we would require a clear break below the 2662 (S1) support level, with the next possible target for the bears being the 2565 (S2) support line.
Author

Phaedros Pantelides
Independent Analyst
Mr Pantelides has graduated from the University of Reading with a degree in BSc Business Economics, where he discovered his passion for trading and analyzing global geopolitics.


