|

Gold – Morning doji star formation pattern to complete a short-term bottom

Technical

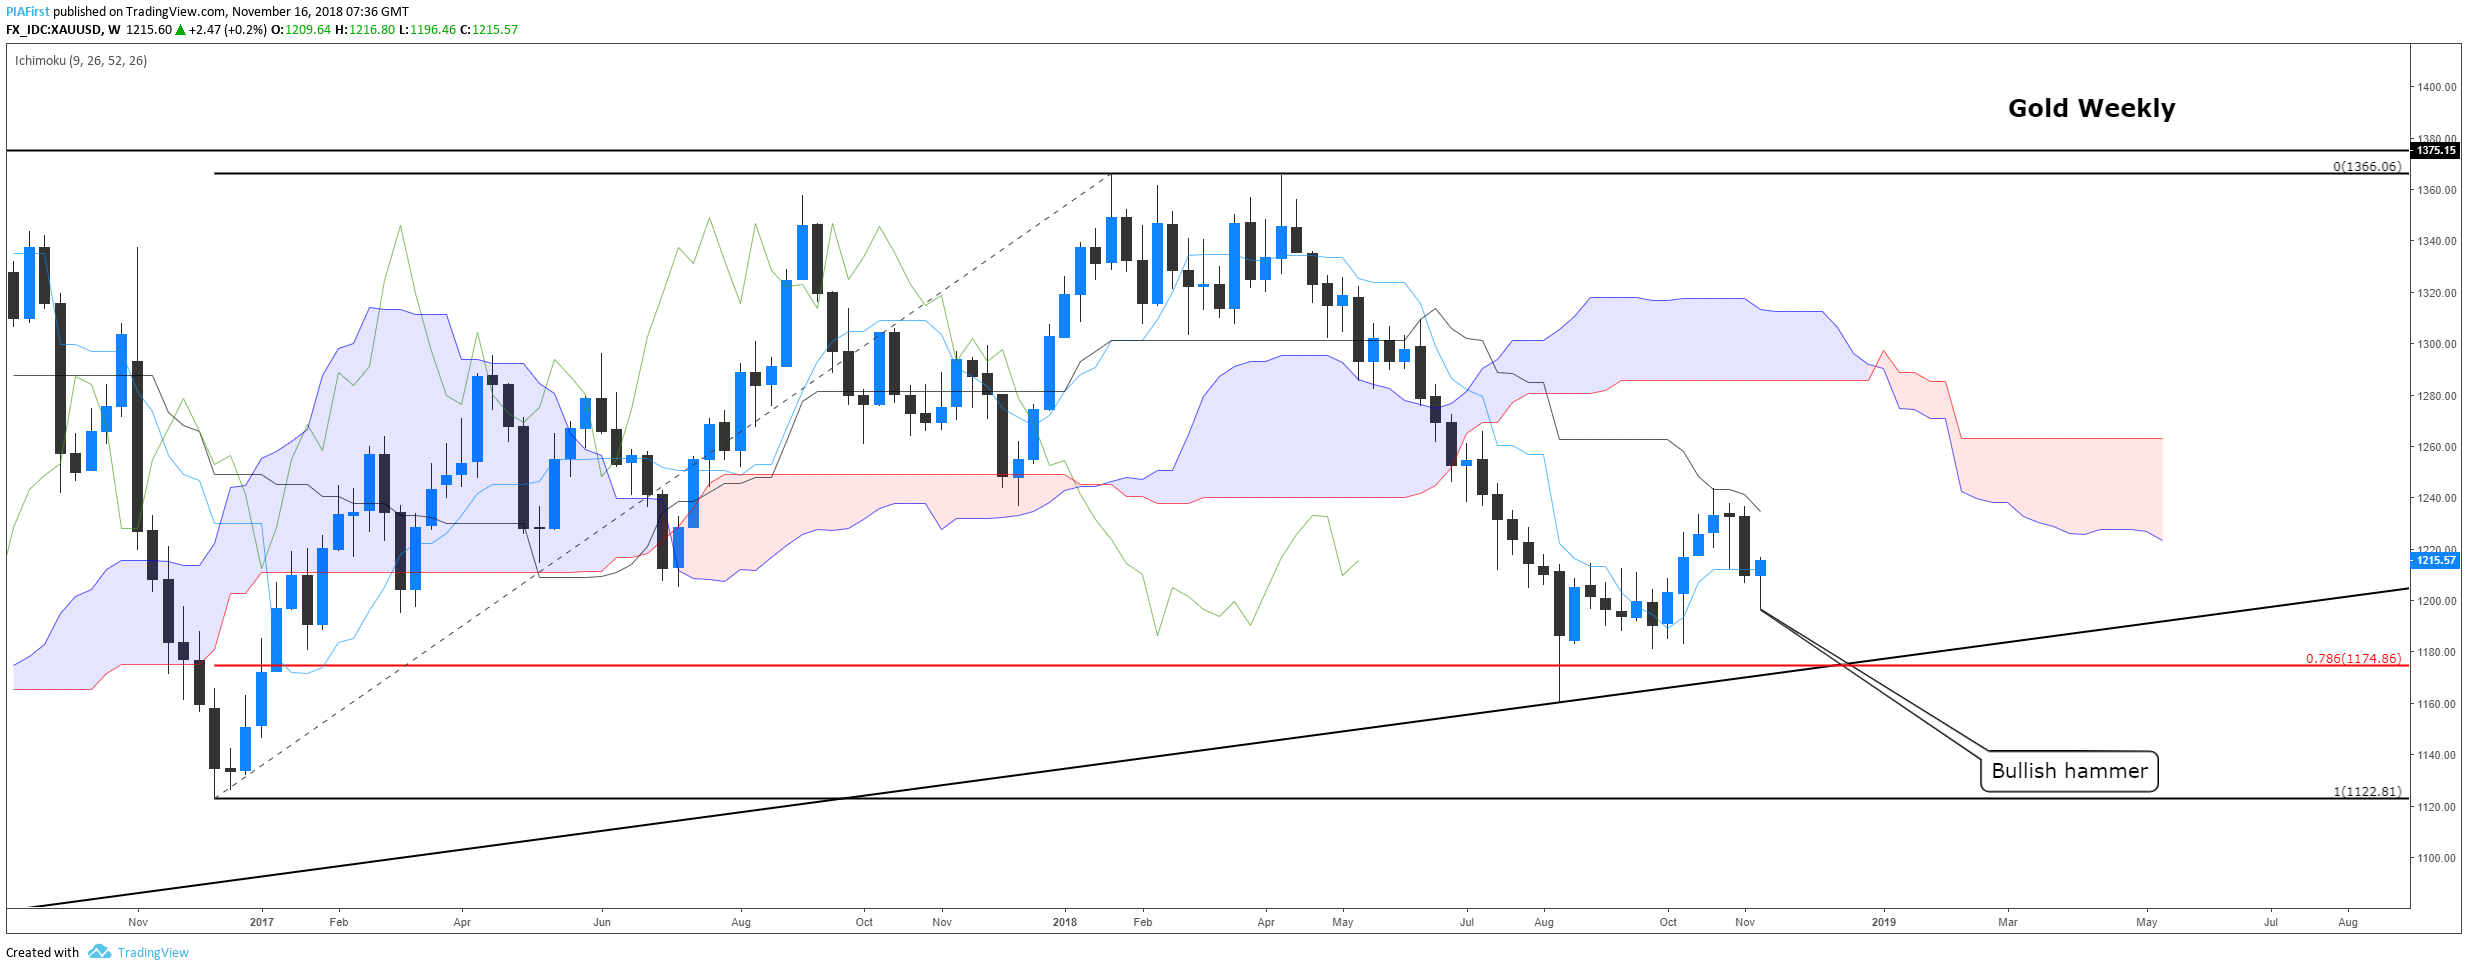
Weekly: The sideways consolidation continued although the market managed to post a significant low at 1160 in mid-August. Levels close to the 78.6% pullback level of 1175 found buyers. This weeks’ price action is forming a bullish hammer. Price action looks to be forming a bottom.

Gold

Daily: The selloff from 1243 has stalled at the 78.6% Fibonacci retracement (1194). This completed and ABCD correction. A morning doji star formation has been posted and this is likely to lead to further gains to complete another ABCD correction on the longer time-frame. Our bias remains bullish and further upside is expected to target resistance at 1243 &1279.

Gold

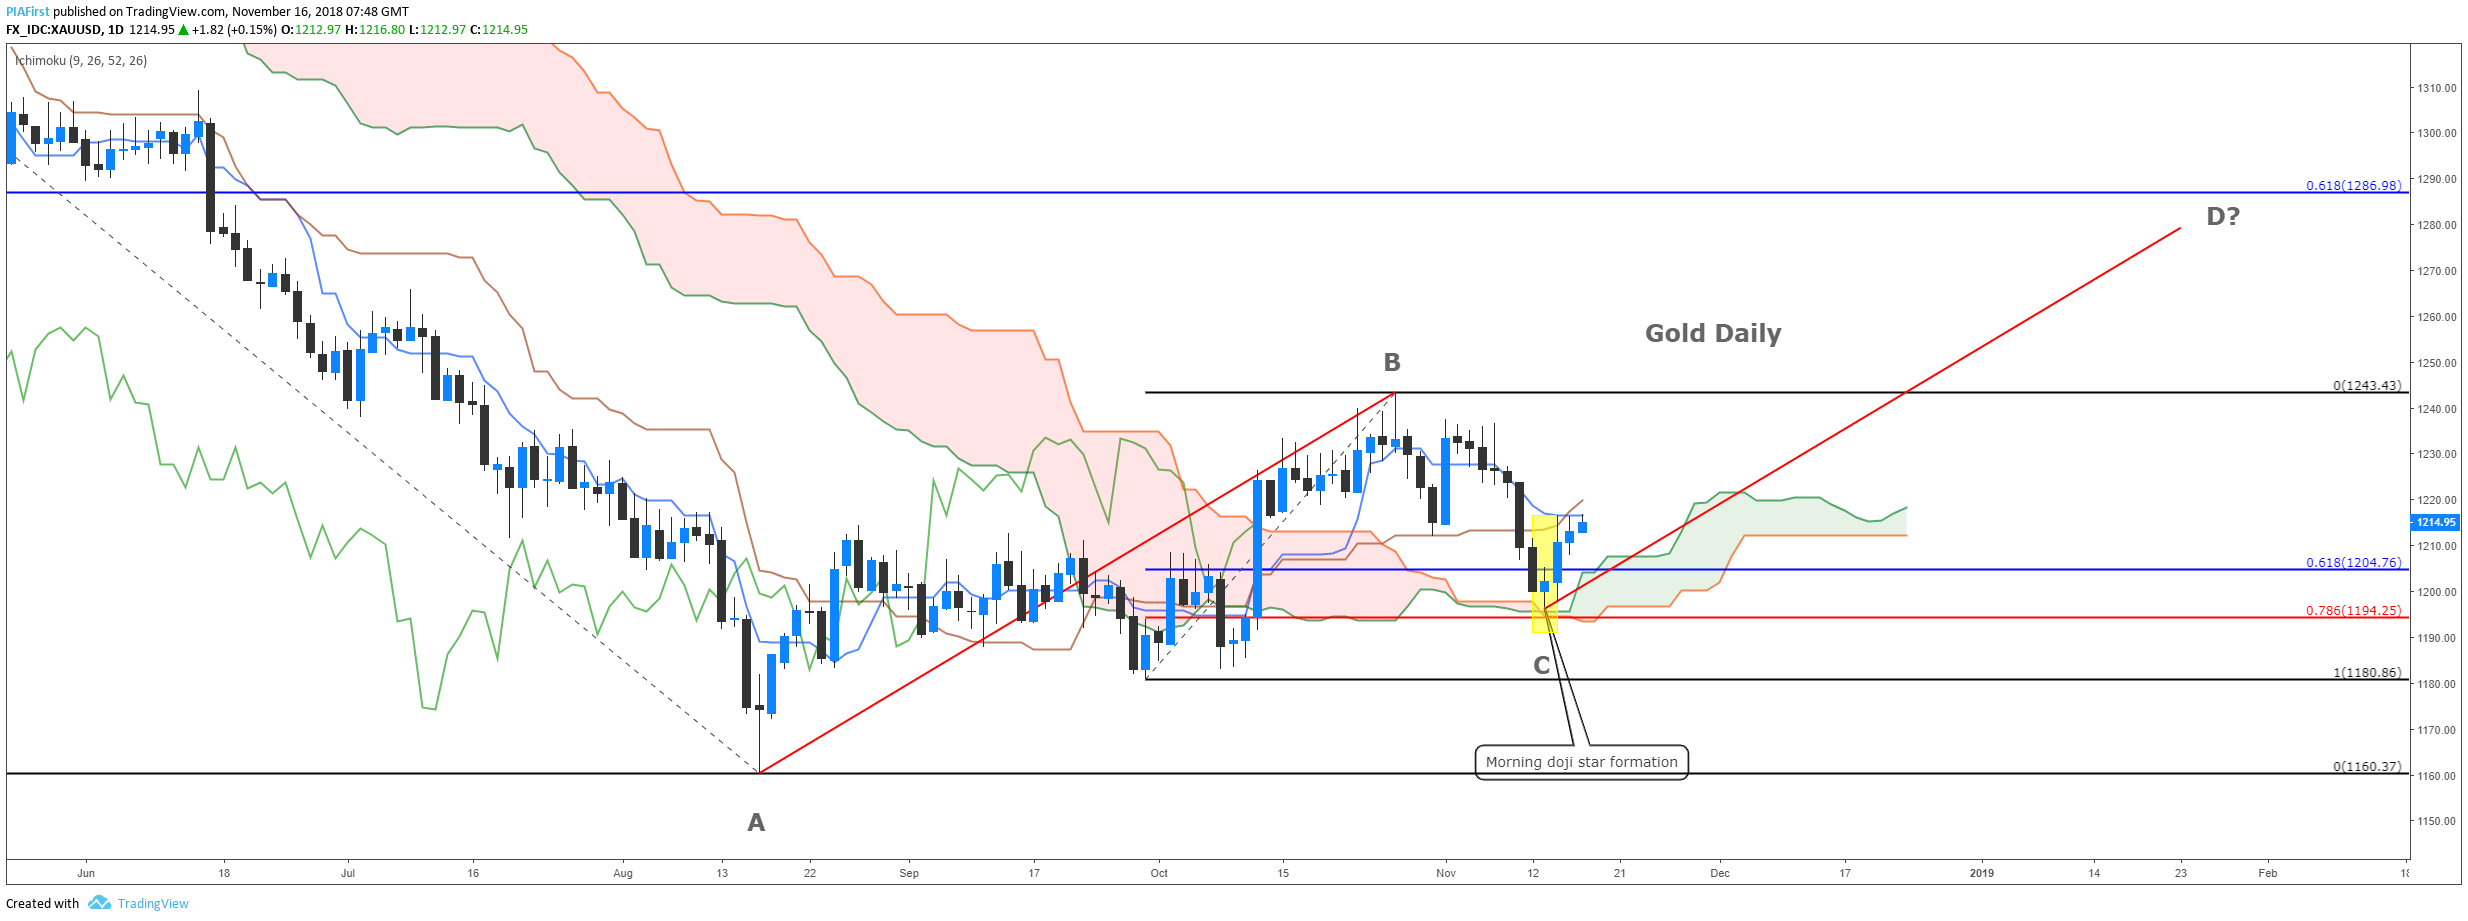
Action: We look to Buy at 1215

Stop: 1195

Target: 1243, 1260 and 1279


Article produced by Pia First for Orbex Limited
Visit PIA First for FX, Commodity & Stock Market trade ideas

Author

Steve O'Hare

Steve O'Hare

Signal Centre

Steve has over 30 years of trading experience in Commodity, Equity and Fixed Income markets, in both research and trading.

More from Steve O'Hare
Share:

Editor's Picks

EUR/USD flat lines around 1.1900; looks to US NFP report for fresh directional impetus

The EUR/USD pair is seen oscillating in a narrow trading band around the 1.1900 mark during the Asian session on Wednesday as traders opt to wait for the release of US monthly employment details before placing fresh directional bets.

GBP/USD recovers losses despite rising UK political risks, BoE rate cut bets

Pound Sterling advances against the US Dollar after registering modest losses in the previous session, trading around 1.3650 during the Asian hours on Wednesday. The pair could extend losses as the Pound Sterling faces pressure from rising political risks in the UK and growing expectations of near-term Bank of England rate cuts.

Gold sticks to gains near $5,050 amid Fed-driven USD weakness; focus remains on US NFP

Gold climbs back above the $5,050 level during the Asian session on Wednesday, reversing a part of the previous day's modest losses amid dovish US Federal Reserve-inspired US Dollar weakness. This, in turn, is seen as a key factor acting as a tailwind for the non-yielding yellow metal. 

Bitcoin, Ethereum and Ripple show no sign of recovery

Bitcoin, Ethereum, and Ripple show signs of cautious stabilization on Wednesday after failing to close above their key resistance levels earlier this week. BTC trades below $69,000, while ETH and XRP also encountered rejection near major resistance levels. With no immediate bullish catalyst, the top three cryptocurrencies continue to show no clear signs of a sustained recovery.

Dollar drops and stocks rally: The week of reckoning for US economic data

Following a sizeable move lower in US technology Stocks last week, we have witnessed a meaningful recovery unfold. The USD Index is in a concerning position; the monthly price continues to hold the south channel support.

XRP holds $1.40 amid ETF inflows and stable derivatives market

Ripple trades under pressure, with immediate support at $1.40 holding at the time of writing on Tuesday. A recovery attempt from last week’s sell-off to $1.12 stalled at $1.54 on Friday, leading to limited price action between the current support and the resistance.