Gold miners as a group is unpopular since it topped in 2011 together with Gold. One well-known Index which represents major Gold Miners is the GDX. The Index topped in 2011 at $67 and declined a massive 81% before forming a low in 2016 at $12.40. None of the ample liquidity from central bank’s money printing moves to the Gold Miners in the past 10 years. The Index remains depressed at low level while major indices, techs, crypto-currencies, cannabis all propel higher in a parabolic move.

Unsurprisingly, Gold Miners remain to be one of the most hated sectors. Sentiment to the sector is still very low, but is it about to turn? In this article, we will take a look at a couple of charts to see if they are ready to move higher.

Overlay Chart of GDX-to-Gold Ratio and GDX 

GDX

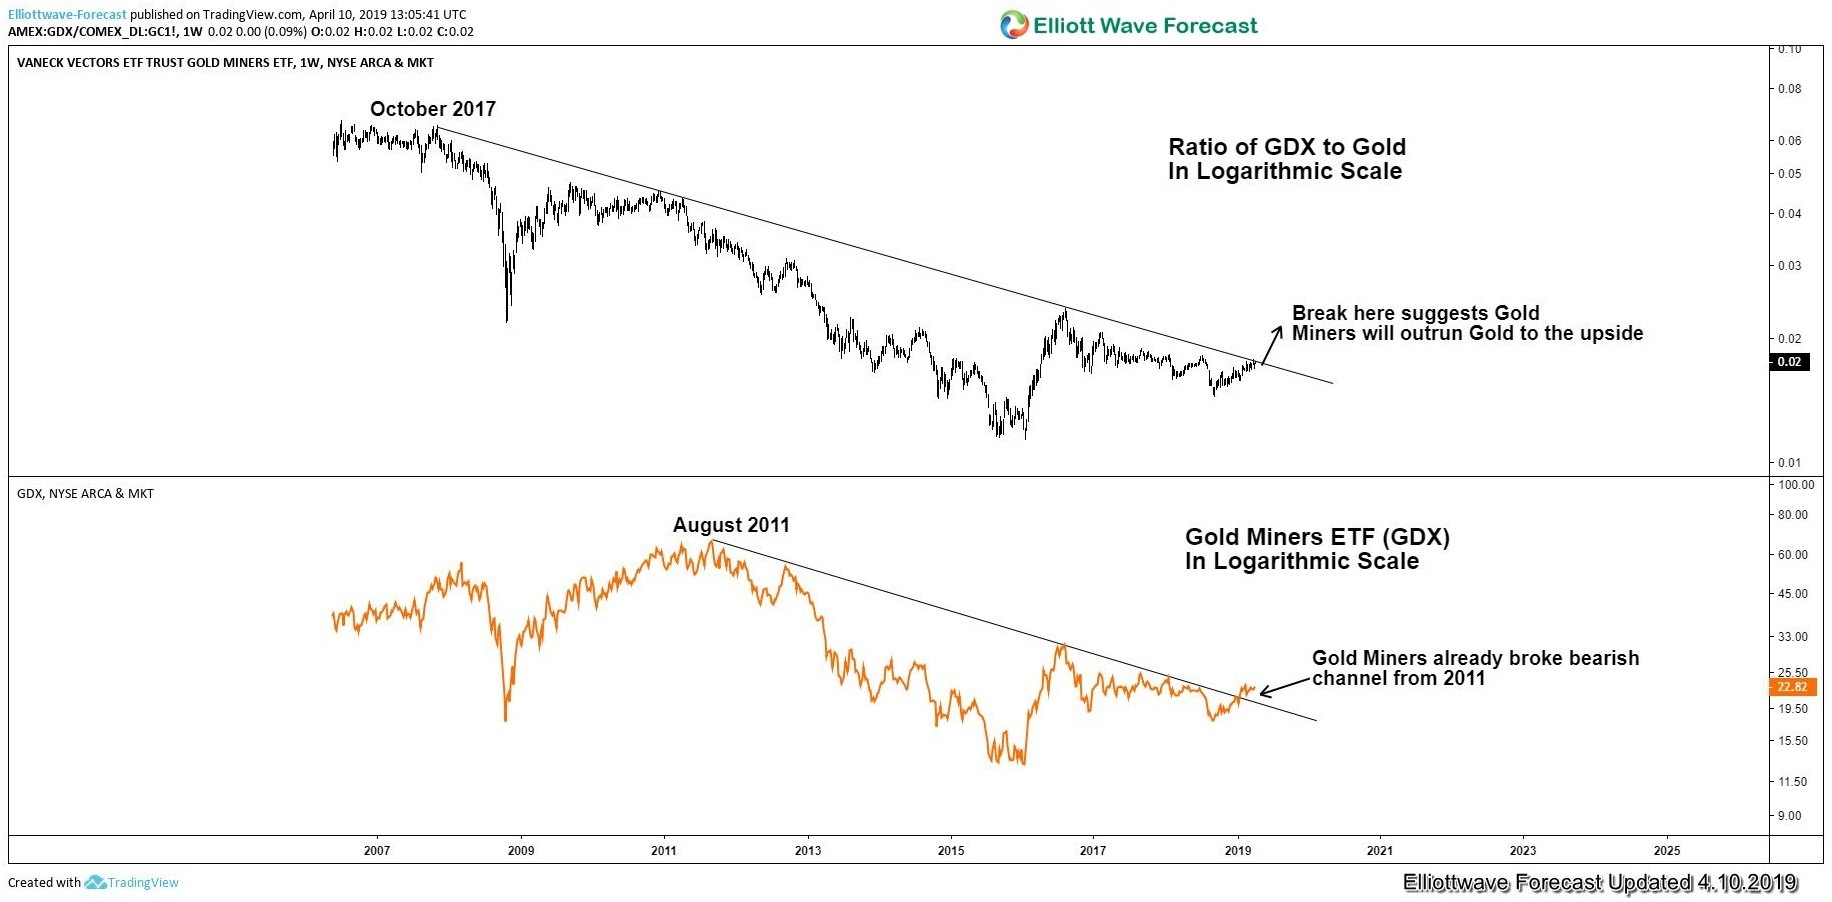
The chart above is an overlay chart of GDX-to-Gold ratio and GDX in logarithmic scale. The upper chart is the GDX-to-Gold ratio while the lower chart is the Gold Miners ETF. We can see a couple of things from the above chart:

  1. A positive correlation between the two charts. They share the same oscillation and move together (up and down) in tandem.  This suggests when the ratio is going higher, then Gold Miners is also going higher. The opposite is also true when the ratio goes lower, Gold miners also goes lower.

  2. GDX-to-Gold ratio (the upper chart) is retesting the bearish trend channel from October 2007 high. A break above this bearish trend line suggests that the Gold Miners Index will outrun Gold to the upside due to rising ratio. A break above the bearish trend line also suggests the Gold Miners should go higher due to the positive correlation.

  3. The GDX chart (the lower chart) has already broken the bearish trend line from August 2011. This is the same bearish channel in Gold (XAUUSD/GLD) as well after it topped in 2011. This suggests the Gold Miners is ready to recover and rally more.

Weekly Elliott Wave Chart of GDX-to-Gold Ratio

GDX

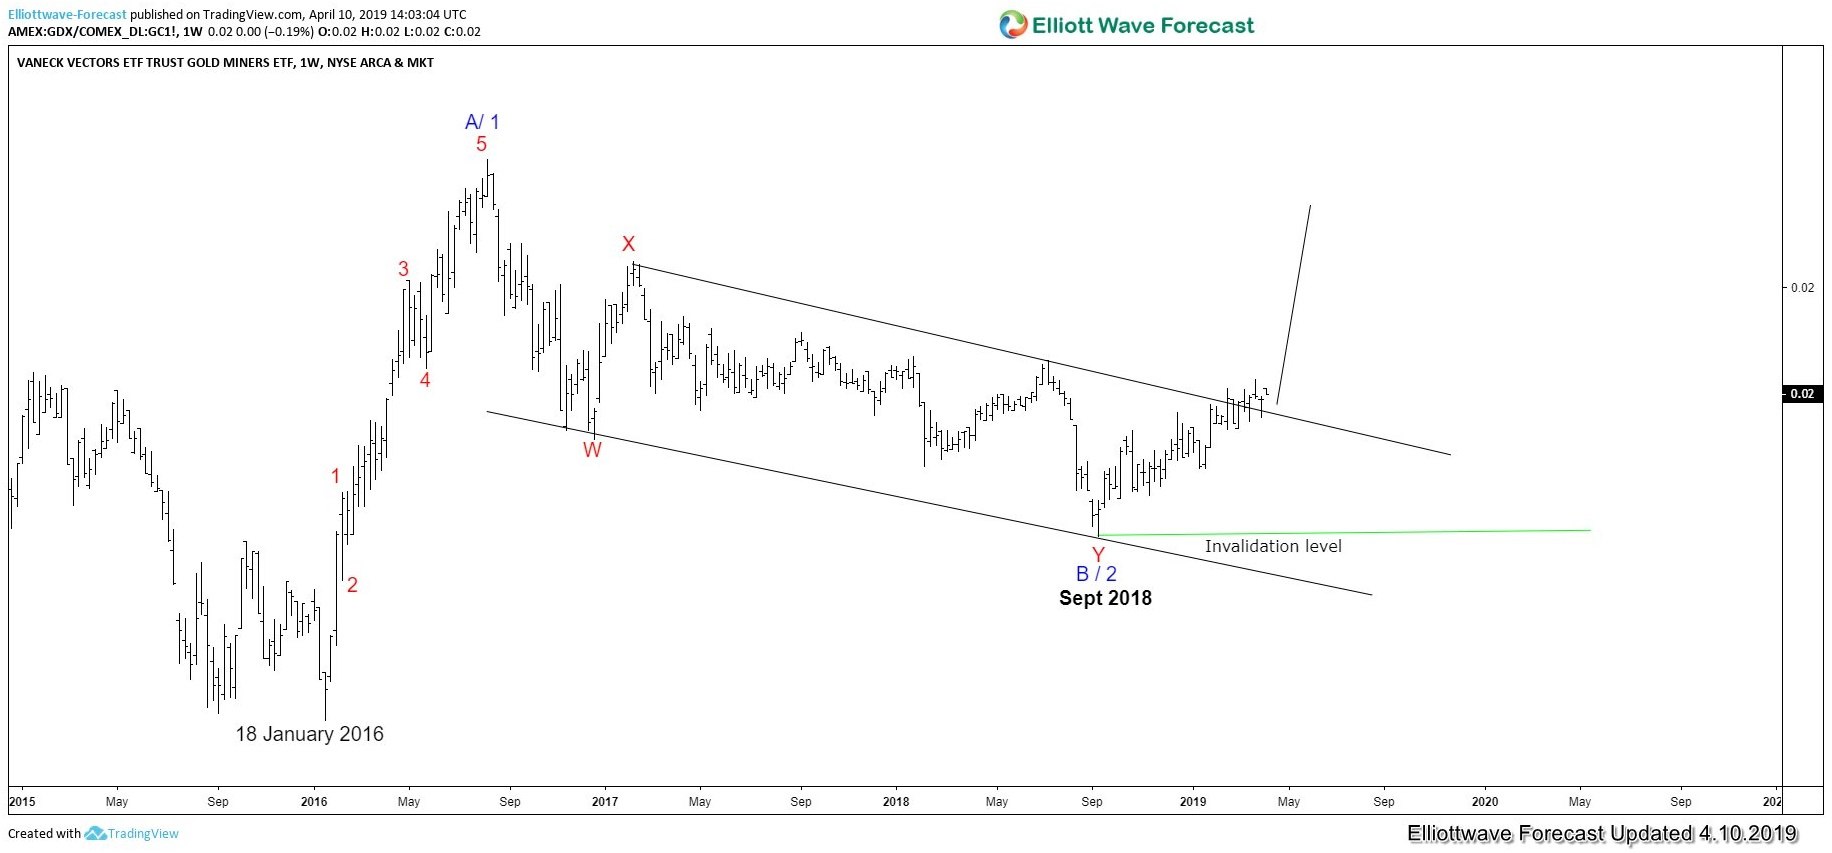
From the chart above, we can see that since it formed a low on January 18, 2016, the rally in the GDX-to-Gold looks impulsive and ended wave A / 1 on August 2016. After that, the ratio is in a protracted pullback & possibly ended wave B /2 already on September 2018. The ratio has since broken the descending bearish channel suggesting the next leg higher (wave C / 3) has already started. It still needs the confirmation by breaking above wave A/1 high, but the outlook looks constructive and promising.

We can conclude from the above two charts that Gold Miners could soon make a move to the upside, especially if we can see the GDX-to-Gold ratio breaking above the 2007 trend line. For regular Elliott Wave update on GDX, Gold, Silver, or other instrument.


Become a Successful Trader and Master Elliott Wave like a Pro. Start your Free 14 Day Trial at - Elliott Wave Forecast.

FURTHER DISCLOSURES AND DISCLAIMER CONCERNING RISK, RESPONSIBILITY AND LIABILITY Trading in the Foreign Exchange market is a challenging opportunity where above average returns are available for educated and experienced investors who are willing to take above average risk. However, before deciding to participate in Foreign Exchange (FX) trading, you should carefully consider your investment objectives, level of xperience and risk appetite. Do not invest or trade capital you cannot afford to lose. EME PROCESSING AND CONSULTING, LLC, THEIR REPRESENTATIVES, AND ANYONE WORKING FOR OR WITHIN WWW.ELLIOTTWAVE- FORECAST.COM is not responsible for any loss from any form of distributed advice, signal, analysis, or content. Again, we fully DISCLOSE to the Subscriber base that the Service as a whole, the individual Parties, Representatives, or owners shall not be liable to any and all Subscribers for any losses or damages as a result of any action taken by the Subscriber from any trade idea or signal posted on the website(s) distributed through any form of social-media, email, the website, and/or any other electronic, written, verbal, or future form of communication . All analysis, trading signals, trading recommendations, all charts, communicated interpretations of the wave counts, and all content from any media form produced by www.Elliottwave-forecast.com and/or the Representatives are solely the opinions and best efforts of the respective author(s). In general Forex instruments are highly leveraged, and traders can lose some or all of their initial margin funds. All content provided by www.Elliottwave-forecast.com is expressed in good faith and is intended to help Subscribers succeed in the marketplace, but it is never guaranteed. There is no “holy grail” to trading or forecasting the market and we are wrong sometimes like everyone else. Please understand and accept the risk involved when making any trading and/or investment decision. UNDERSTAND that all the content we provide is protected through copyright of EME PROCESSING AND CONSULTING, LLC. It is illegal to disseminate in any form of communication any part or all of our proprietary information without specific authorization. UNDERSTAND that you also agree to not allow persons that are not PAID SUBSCRIBERS to view any of the content not released publicly. IF YOU ARE FOUND TO BE IN VIOLATION OF THESE RESTRICTIONS you or your firm (as the Subscriber) will be charged fully with no discount for one year subscription to our Premium Plus Plan at $1,799.88 for EACH person or firm who received any of our content illegally through the respected intermediary’s (Subscriber in violation of terms) channel(s) of communication.

Recommended Content


Recommended Content

Editors’ Picks

USD/JPY holds near 155.50 after Tokyo CPI inflation eases more than expected

USD/JPY holds near 155.50 after Tokyo CPI inflation eases more than expected

USD/JPY is trading tightly just below the 156.00 handle, hugging multi-year highs as the Yen continues to deflate. The pair is trading into 30-plus year highs, and bullish momentum is targeting all-time record bids beyond 160.00, a price level the pair hasn’t reached since 1990.

USD/JPY News

AUD/USD stands firm above 0.6500 with markets bracing for Aussie PPI, US inflation

AUD/USD stands firm above 0.6500 with markets bracing for Aussie PPI, US inflation

The Aussie Dollar begins Friday’s Asian session on the right foot against the Greenback after posting gains of 0.33% on Thursday. The AUD/USD advance was sponsored by a United States report showing the economy is growing below estimates while inflation picked up.

AUD/USD News

Gold soars as US economic woes and inflation fears grip investors

Gold soars as US economic woes and inflation fears grip investors

Gold prices advanced modestly during Thursday’s North American session, gaining more than 0.5% following the release of crucial economic data from the United States. GDP figures for the first quarter of 2024 missed estimates, increasing speculation that the US Fed could lower borrowing costs.

Gold News

Ethereum could remain inside key range as Consensys sues SEC over ETH security status

Ethereum could remain inside key range as Consensys sues SEC over ETH security status

Ethereum appears to have returned to its consolidating move on Thursday, canceling rally expectations. This comes after Consensys filed a lawsuit against the US SEC and insider sources informing Reuters of the unlikelihood of a spot ETH ETF approval in May.

Read more

Bank of Japan expected to keep interest rates on hold after landmark hike

Bank of Japan expected to keep interest rates on hold after landmark hike

The Bank of Japan is set to leave its short-term rate target unchanged in the range between 0% and 0.1% on Friday, following the conclusion of its two-day monetary policy review meeting for April. The BoJ will announce its decision on Friday at around 3:00 GMT.

Read more

Majors

Cryptocurrencies

Signatures