Gold: Long-term potential remains strong

Long-term potential for gold remains strong!
- Technical analysis update for the SPDR Gold Shares ETF.
- Long-term bullish continuation anticipated once current correction is completed.
- Looks like a deeper retracement may come in the near-term, before resumption of the rally.
Long-term breakout
Following the August 2018 swing low of $111.06, GLD rallied 32.2% to the September 2019 high of $146.82. That rally found resistance in the area of Fibonacci confluence, including the 50% retracement of the full downtrend measured off the 2011 peak, which was at $143.04. Note that the 14-week Relative Strength Index (RSI) was quite overbought at that point (83.52), the most overbought since the extreme 2011 peak (83.87).
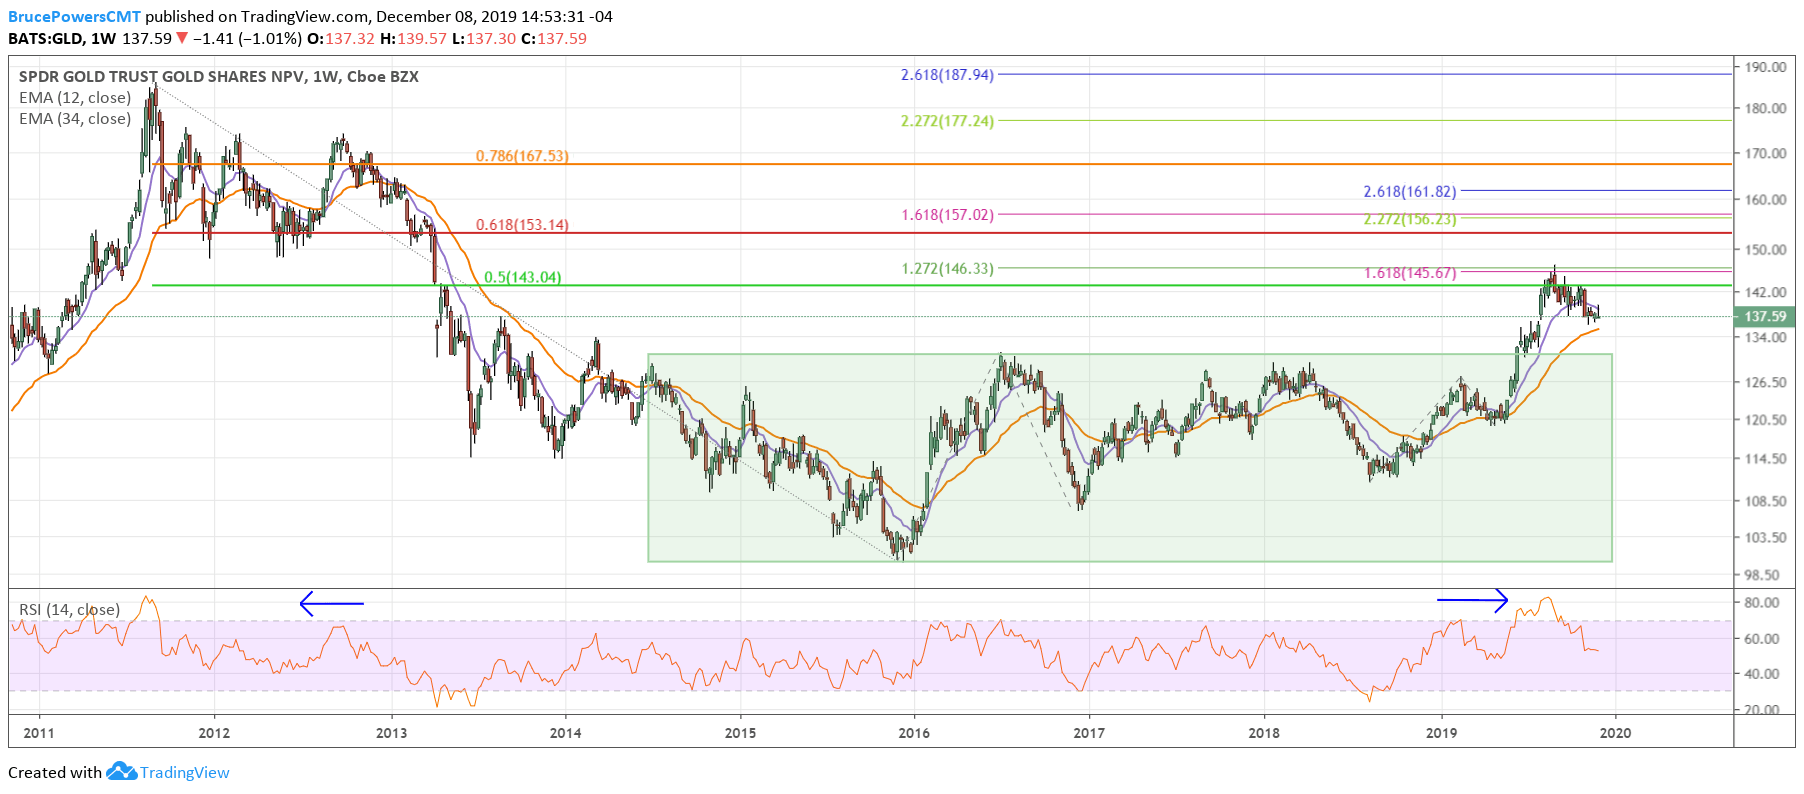
GLD Weekly Chart – long-term
A bullish crossover of the 10-week exponential moving average (ema) and the 34-week ema occurred at the beginning of 2019. Most importantly, the rally took GLD out of a bottoming pattern to a 71-month high. Once $131.15 (July 2016 swing high) was broken to the upside price advanced to the September 2019 high with conviction, as there was barely a pullback of any significance.
Normal retracement to date
As is normal in financial markets, once a breakout of significance occurs (multi-year breakout off bottom in this case), price will retrace some degree of the advance towards the breakout area. The degree of retracement will vary and may provide some insight into the characteristics of the trend pattern. Following the retracement, a resumption of the initial trend can be expected unless shown otherwise.
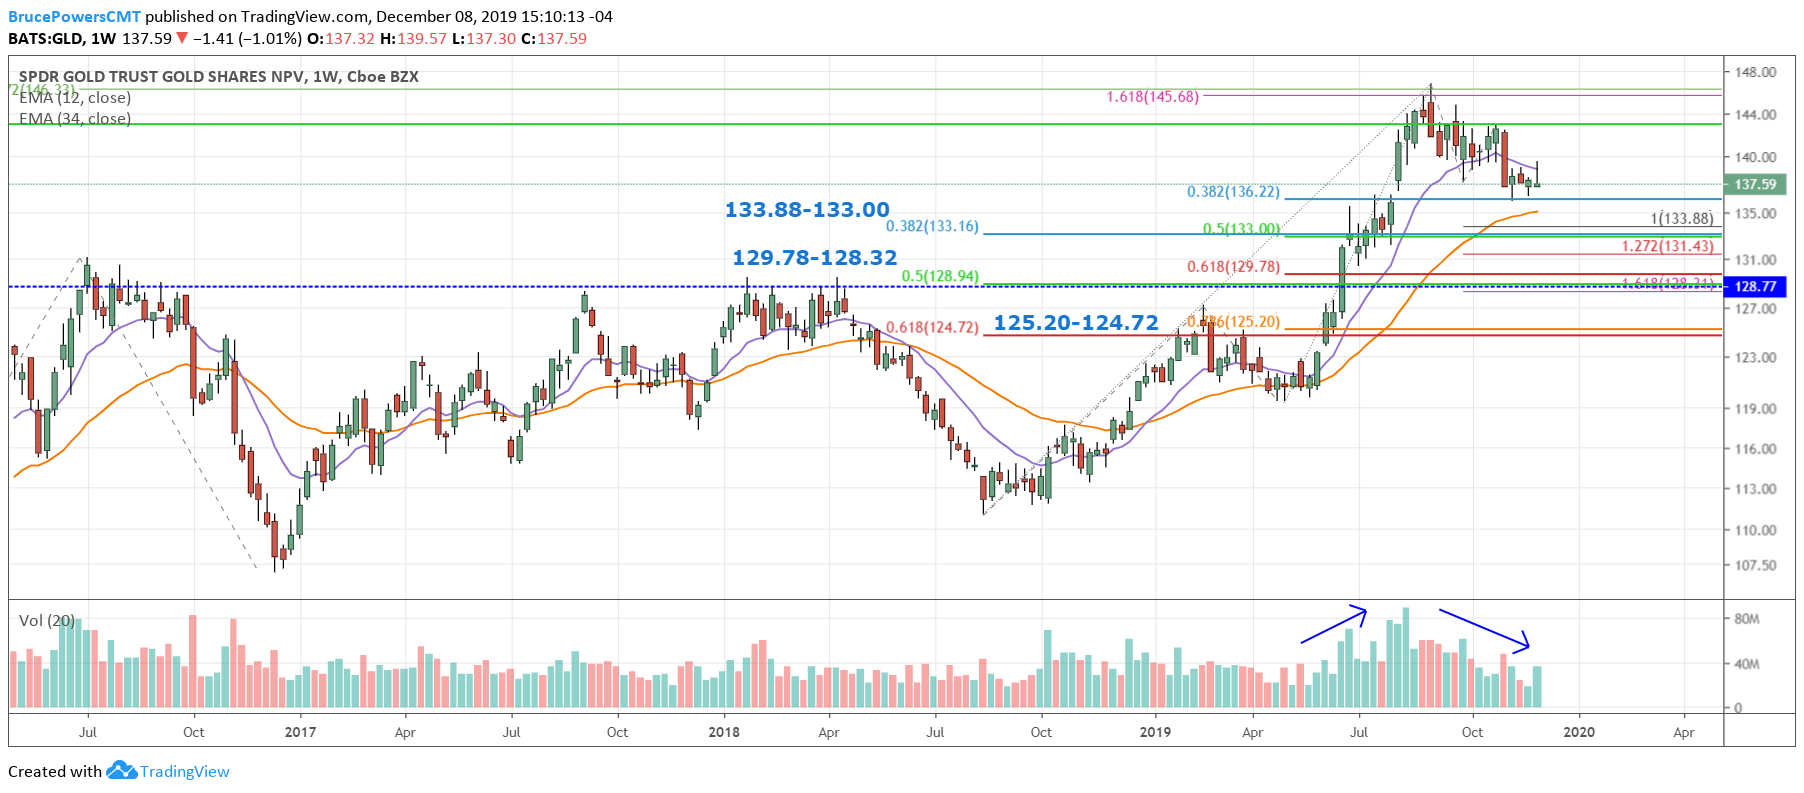
GLD Weekly Chart – near-term
To date, the retracement has reached $136.19, thereby completing a minimum Fibonacci retracement of 38.2% (at $136.40). Volume has been falling as price declines. Note that price has fallen below and closed below the 10-week ema (blue line) for the past five weeks and tested it as resistance for the past four. This is a sign of short-term weakness and points to further selling pressure unless something changes (such as daily close above last week’s $139.57 high).
Multiple lower possible support zones
If price does continue to fall, then watch the next three potential support zones for subsequent signs of a bullish reversal:
- 133.88 – 133.00
- 129.78 – 128.32
- 125.20 – 124.72
Each price zone is derived from multiple Fibonacci retracement and projection levels, as well as prior price pivot levels.
Author

Bruce Powers, CMT
Markets Today
Bruce Powers, CMT, is a global markets technical analyst covering stocks, market indices, and ETFs, cryptocurrencies, Forex, oil and metals.


