Gold is starting its move

Everything good comes to its end sooner or later, and the higher one rises, the deeper one falls. These could very well apply to the current situation around PMs.
Speaking of indications pointing to the situation being excessive, let’s take a look at the USD Index.
Remember when in early 2018 we wrote that the USD Index was bottoming due to a very powerful combination of support levels? Practically nobody wanted to read that as everyone “knew” that the USD Index is going to fall below 80. We were notified that people were hating on us in some blog comments for disclosing our opinion - that the USD Index was bottoming, and gold was topping. People were very unhappy with us writing that day after day, even though the USD Index refused to soar, and gold was not declining.
Well, it’s the same right now.
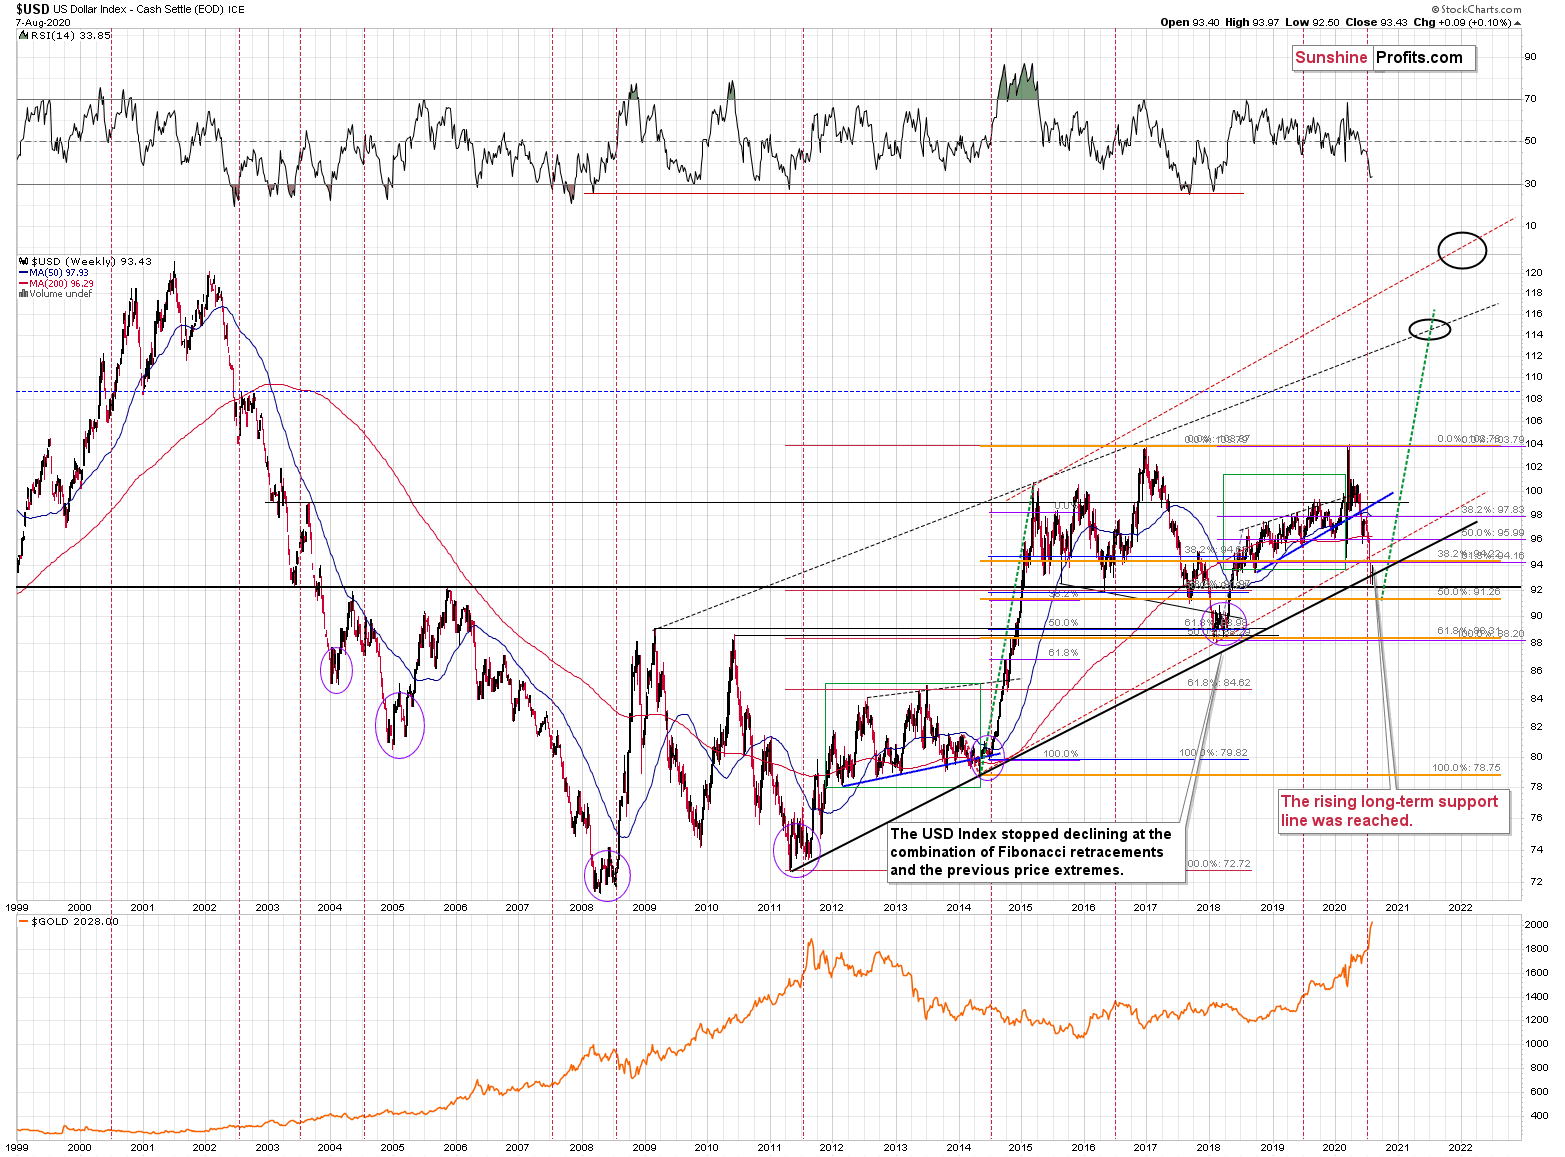
The USD Index is at a powerful combination of support levels. One of them is the rising, long-term, black support line that’s based on the 2011 and 2014 bottoms.
The other major, long-term factor is the proximity to the 92 level – that’s when gold topped in 2004, 2005, and where it – approximately – bottomed in 2015, and 2016.
The USDX just moved to these profound support levels, and it’s very oversold on a short-term basis. It all happened in the middle of the year, which is when the USDX formed major bottoms on many occasions. This makes a short-term rally here very likely.
While it might not be visible at the first sight (you can click on the chart to enlarge it), the USD Index moved briefly below the long-term, black support line and then it invalidated this breakdown before the end of the week. This is a very bullish indication for the next few weeks.
We even saw a confirmation from USD’s short-term chart.
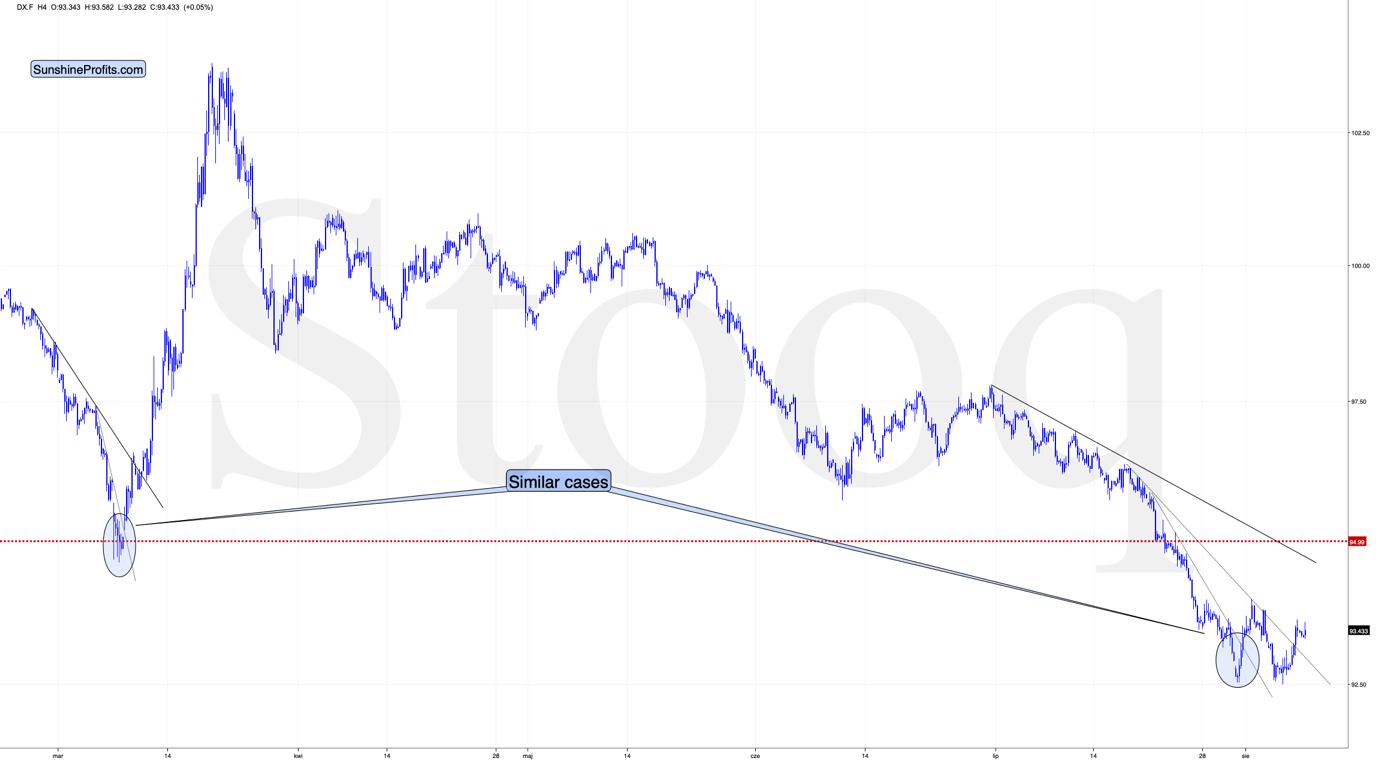
The U.S. currency is finally after a decisive short-term breakout. In fact, it’s already after two short-term breakouts. Looking at the short-term picture only, the USD’s sideways trading could be both: a double-bottom pattern, or a flag consolidation pattern. The former would be bullish, and the latter would be bearish. Based on the previous long-term chart, the bullish interpretation is stronger.
Back in March, the short-term breakout in the USD Index was the thing that triggered the powerful rally in it, as well as a powerful plunge in the precious metals market. It’s generally a good gold trading tip to monitor the USD Index’s performance.
Consequently, based on this analogy, the implications for the near term are bearish for the PMs. Especially, when we consider the fact that Gold Miners Bullish Percent Index showed the highest possible overbought reading recently.
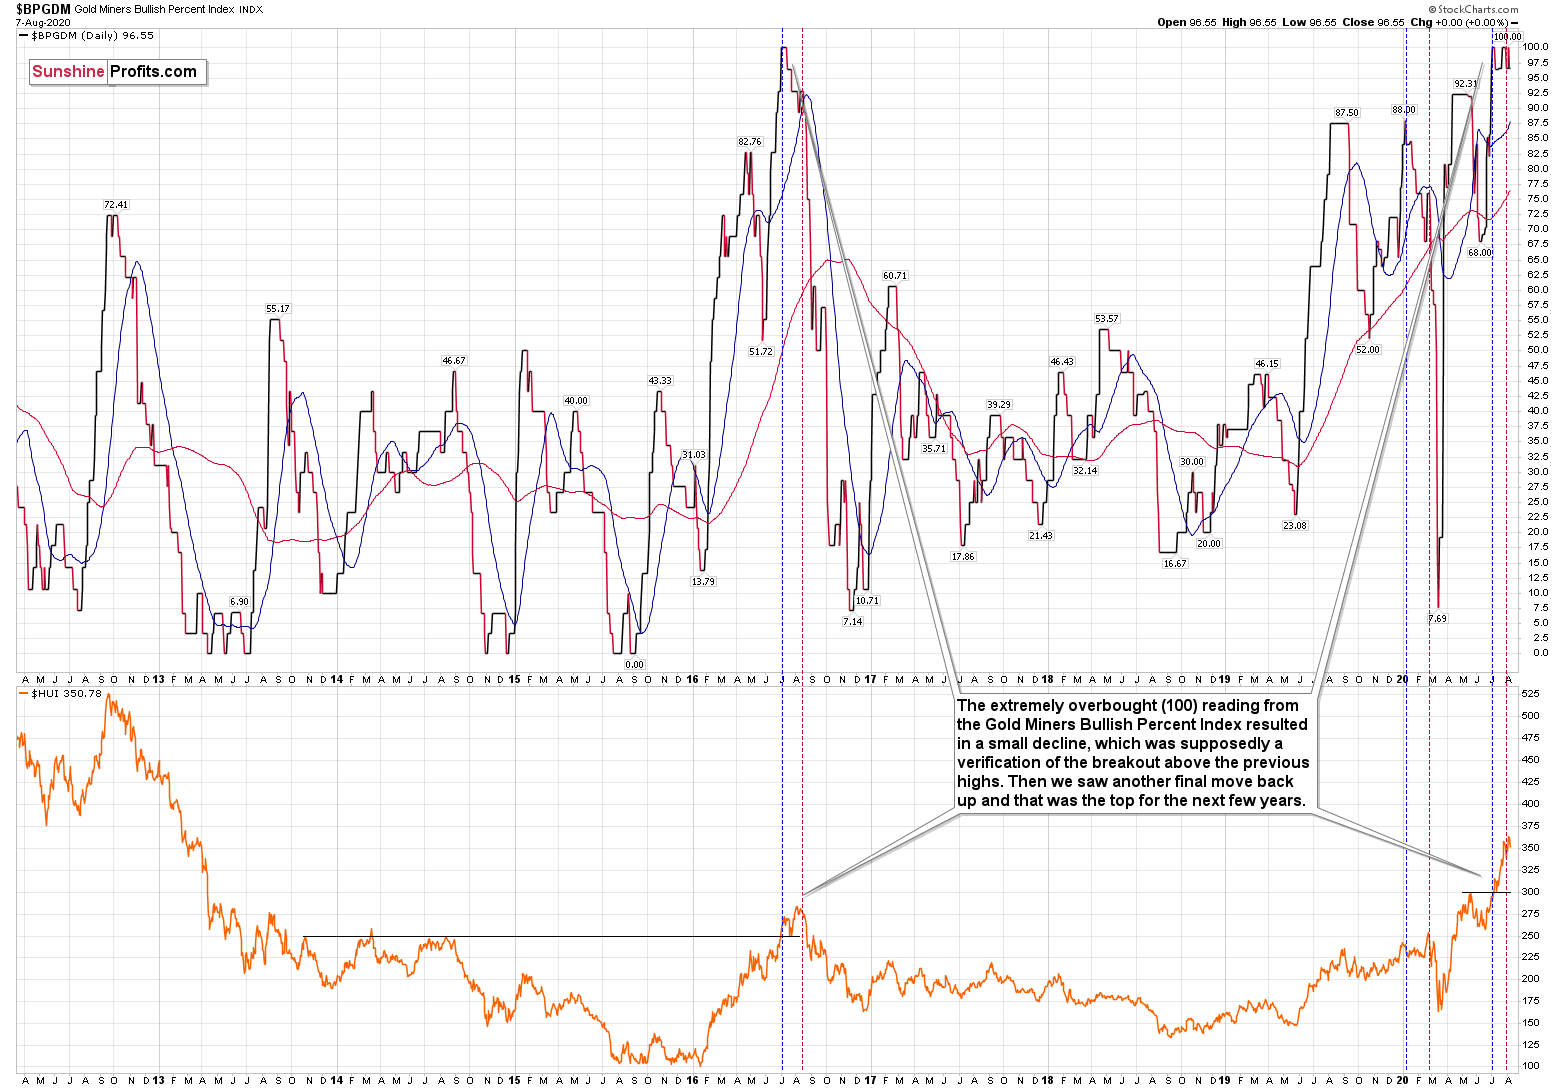
The excessive bullishness was present at the 2016 top as well and it didn’t cause the situation to be any less bearish in reality. All markets periodically get ahead of themselves regardless of how bullish the long-term outlook really is. Then, they correct. If the upswing was significant, the correction is also quite often significant.
Please note that back in 2016, there was an additional quick upswing before the slide and this additional upswing has caused the Gold Miners Bullish Percent Index to move up once again for a few days. It then declined once again. We saw something similar also this time. In this case, this move up took the index once again to the 100 level, while in 2016 this wasn’t the case. But still, the similarity remains present.
Back in 2016, when we saw this phenomenon, it was already after the top, and right before the big decline. Given the situation in the USD Index, it seems that we’re seeing the same thing also this time.
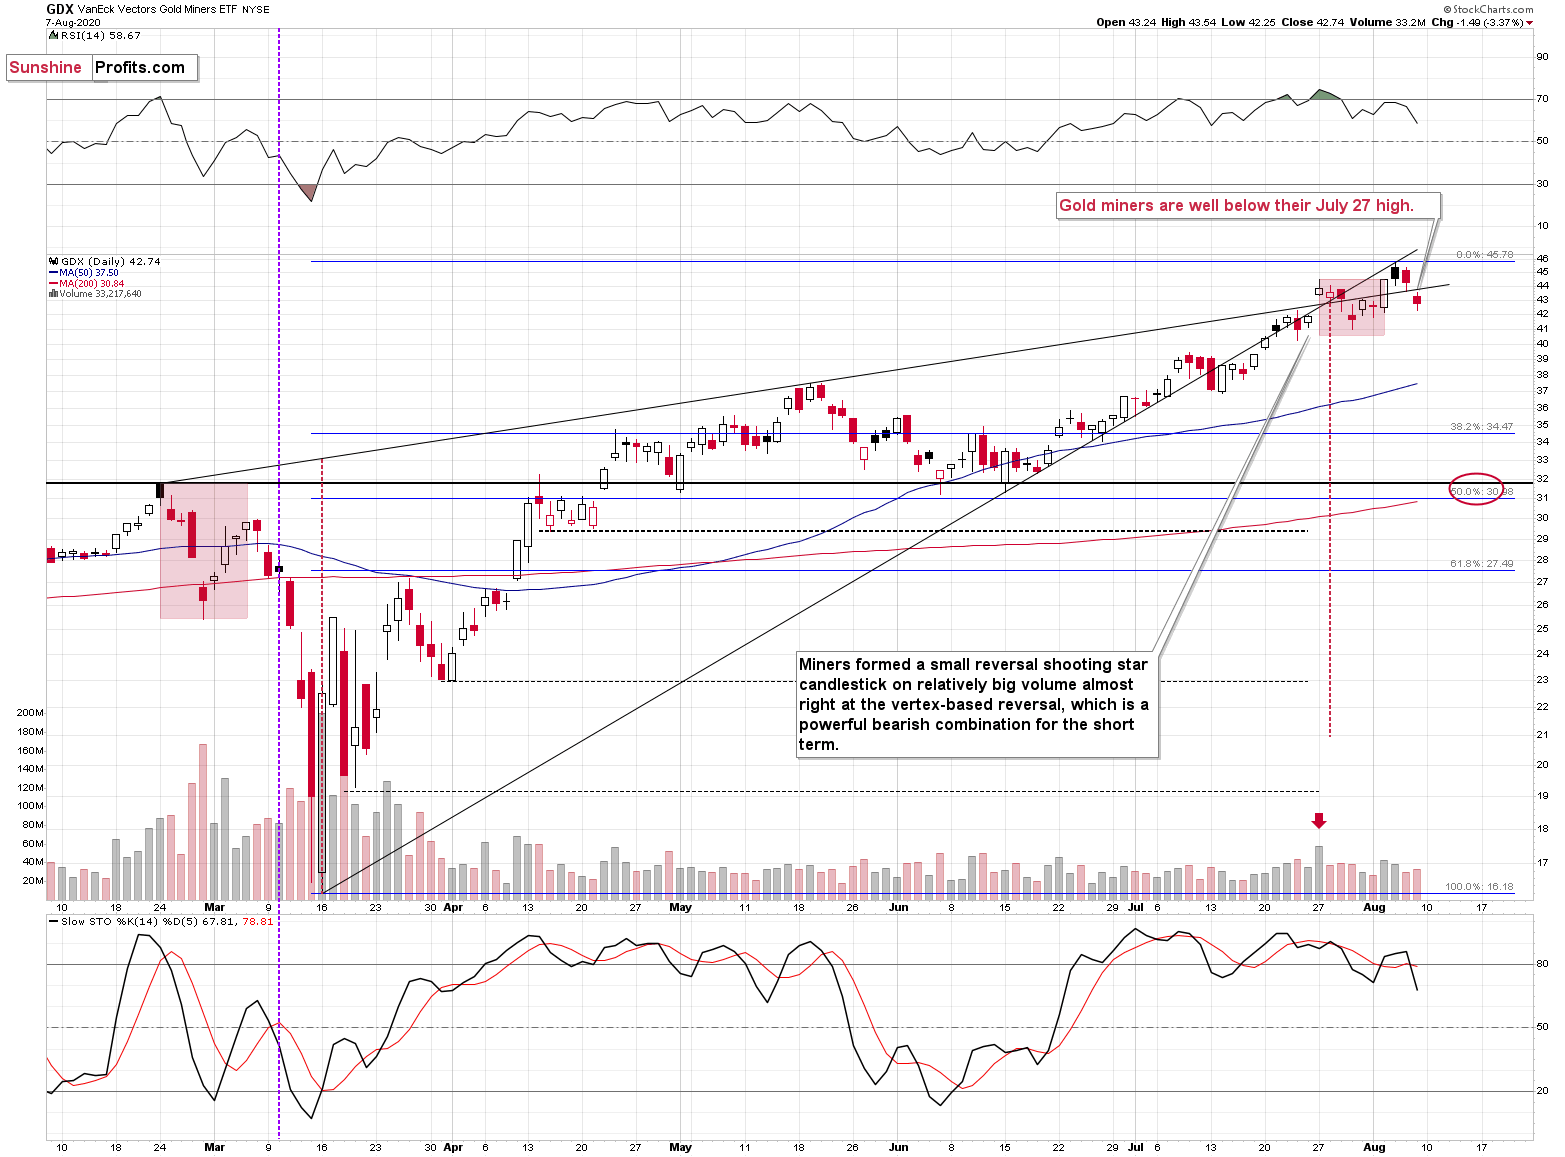
On Friday, gold stocks declined significantly, and they moved visibly below their July 27 high, even though gold ended its Friday’s session almost $100 higher. Mining stocks’ underperformance is quite extreme, especially that it’s connected with silver’s very strong short-term performance. This is what we usually see when the precious metals market is topping.
Please note that the miners topped almost right at the vertex of the huge rising wedge pattern. Quoting our previous analysis:
(…) huge rising wedge pattern is about to form a vertex today or tomorrow. The same rule that applies to triangles has implications also here. The vertex is quite likely to mark a reversal date. Given the overbought status of the RSI (given today’s upswing, it's almost certain to move above 70 once again) as well as miners recent unwillingness to track gold during its continuous rally, it’s highly likely in my view that this will be a top.
The downside target for the mining stocks is very far from the current price. However, if the stock market declines significantly once again, miners can indeed fall far, even if gold declines by “only” a couple of hundreds of dollars.
We marked also an interim price target that’s based on a few other techniques, with a red ellipse – at about $31 - $32. One of the techniques is the 50% Fibonacci retracement level based on the March – August rally, and the other two are the February high, and the May and June lows. That’s also where – approximately – we have the 200-day moving average. The latter is not particularly strong in case of the GDX ETF, so we wouldn’t say that it creates any significant support on its own, but it serves as a good confirmation of the other techniques.
And they're pointing one way…
Want free follow-ups to the above article and details not available to 99%+ investors? Sign up to our free newsletter today!
Want free follow-ups to the above article and details not available to 99%+ investors? Sign up to our free newsletter today!
Author

Przemyslaw Radomski, CFA
Sunshine Profits
Przemyslaw Radomski, CFA (PR) is a precious metals investor and analyst who takes advantage of the emotionality on the markets, and invites you to do the same. His company, Sunshine Profits, publishes analytical software that any


