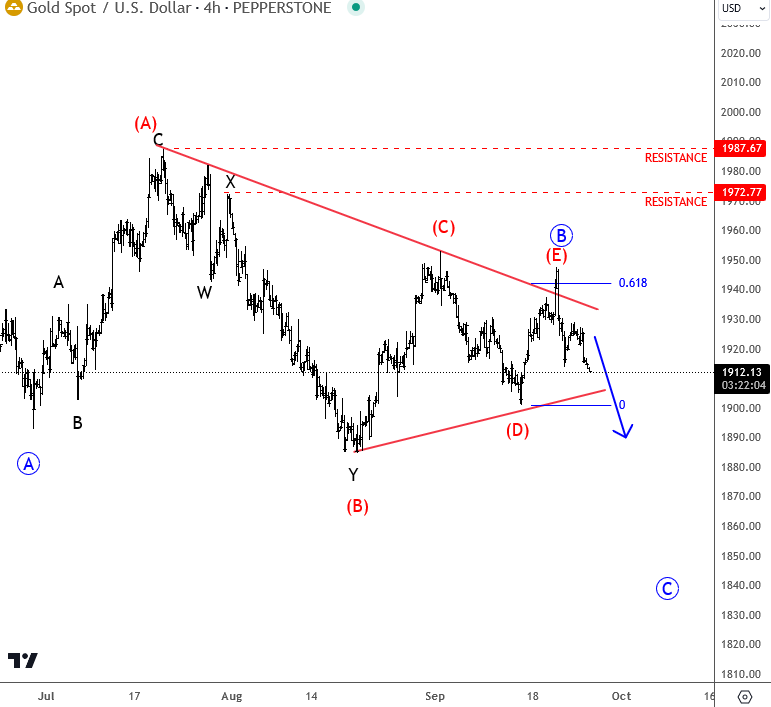
After the recent strong turn down on gold we adjusted the wave count and think that the price action from the July low is wave B, but can still meet higher prices if we consider a running flat or possibly even running triangle scenario since a drop from 1990 can be a complex w-x-y in subwave (B). Because of a recent sharp drop in the 4-hour chart from around 1950 at the start of September, it's a higher probability for a bearish running triangle pattern within wave B rather than a flat. In fact subwave (D) is also finished now followed by wave (E) that stoped at the 61.8% Fib resistance from here we can see nice turn, towards the lower side of a pattern. Keep an eye on the red trendline support now and the 1900 area; break below that zone will confirm a new drop for wave C, possibly even to around 1850 or lower.
Get Full Access To Our Premium Elliott Wave Analysis For 14 Days. Click here.
By using Wavetraders website, any services, products, and content contained here, you agree that use of our service is entirely at your own risk. You understand that there is a very high degree of risk involved in trading on the markets. We assume no responsibility or liability for your trading and investment results. The charts, and all articles published on www.wavetraders.com are provided for informational and educational purposes only!
By using the information and services of www.ew-forecast.com you assume full responsibility for any and all gains and losses, financial, emotional or otherwise, experienced, suffered or incurred by you.
Recommended Content
Editors’ Picks
EUR/USD stays under modest bearish pressure below 1.0900

EUR/USD continues to trade in negative territory below 1.0900 in the second half of the day on Monday. In the absence of high-impact data releases, the risk-averse market atmosphere helps the US Dollar hold its ground and doesn't allow the pair to gain traction.
Gold price extends correction from all-time highs

Gold price staged a deep correction from the record top it set near $2,150 and declined to the $2,050 area. Recovering US Treasury bond yields help the USD find demand and makes it difficult for XAU/USD to preserve its bullish momentum.
GBP/USD declines toward 1.2650 on renewed USD strength

GBP/USD stays on the back foot and trades near 1.2650 in the early American session. The US Dollar is finding support from the escalating Middle East conflict, weighing on the pair. However, the downside seems limited on increased Fed rate cut bets.
Bitcoin price could revisit $45,000 according to crypto analyst

Bitcoin price crossed the $41,000 mark on Binance, in its ongoing uptrend. BTC price rally is likely driven by the anticipation of Spot Bitcoin ETF approval. There are more catalysts driving BTC price gains in the current cycle.
The week ahead – US Nonfarm Payrolls, RBA and BoC in spotlight

Last month’s October jobs report was the first one this year when the headline number came in below market expectations, though not by enough to raise concerns over the resilience of the US economy.