|

Gold is coming to the apex of a triangular pattern

SILVER

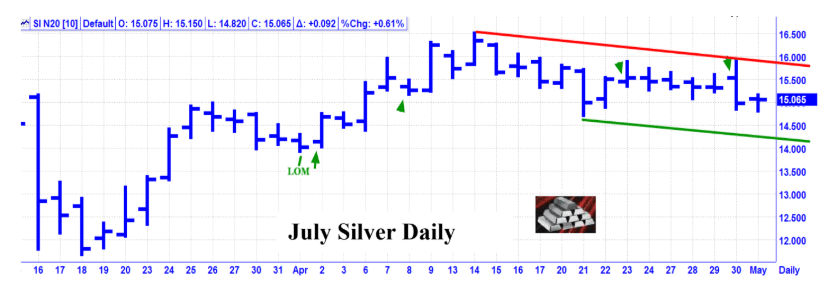
April Review Only – “Silver had a March meltdown, reaching the lowest low, since January 2009. Following a good rebound, the market is now trading sideways. Key Dates – 4/2, 4/8, 4/23, 4/30”

Results – 4/2 was very close in price and one day past the low of the month. 4/8 was a good pullback low. 4/23 was a good high. 4/30 was a very good high. Score – 4 out of 4 good dates = 100%.
GOLD

April Review – “During March, Gold made its high of the month near the 3/9 Full Moon at Perigee, then plunged more than $200, into a mid-month low. From that low, Gold rallied to near its mid-month high, for a wild roller coaster ride. Key Dates – 4/8, 4/23”

Results – 4/8 was a good pullback low. 4/23 was a good high. Score – 2 out of 2 good dates = 100%.

May Update – The Gold chart looks like Gold is coming to an inflexion point or apex for a wedge or triangle pattern. Whichever way it breaks out, it should be soon, and should generate a substantial move.

Key Dates – 5/5, 5/7, 5/11, 5/22

This is an excerpt from the Astro Trend newsletter. Astro-Trend covers about thirty futures related markets including the major Financial Markets, such as the Stock Market, T-Bonds, Currencies, and most major commodities. We also offer intra day data which identifies potential change in trend points to the minute.

Author

Norm Winski

Norm Winski

Independent Analyst

www.astro-trend.com

More from Norm Winski
Share:

Editor's Picks

GBP/USD: Downward-sloping trendline near 1.3470 remains key barrier

The British pound faces selling pressure against its major currency peers, trading 0.1% lower at around 1.3420 against the US Dollar during the European trading session on Tuesday.

Euro clings to the bid bias above 1.1500

EUR/USD has picked up pace, reversing Monday’s decline and advancing past the 1.1500 barrier on Tuesday. In the meantime, hopes for a diplomatic solution to the Middle East crisis keep the US Dollar under modest downside pressure, helping spot in its recovery.

Coinbase Bitcoin Premium Index extends historical negative streak as risk appetite deteriorates
The Coinbase Bitcoin Premium Index extends its negative streak to 78 consecutive days on Tuesday, the longest on record. This reading comes amid the ongoing bearish trend, which has seen Bitcoin (BTC) drop by almost 50% from its record high to trade around $64,000.
Why the WTI sell-off may be hiding a supply warning
Prices for the barrel of the American Oil benchmark have fallen sharply as hopes of a US-Iran agreement have resurfaced, but a deeply backwardated Oil curve, tight Cushing stocks and light speculative positioning all warn that the sell-off may have gone too far.
9-3: Is the Federal Reserve’s vote tally Warsh's new forward guidance?
The rate did not move. Neither did the statement, and that’s the more interesting fact. Set the July 29 Federal Open Market Committee (FOMC) statement beside the one issued on June 17, and the two documents are identical apart from a single verb and a paragraph at the bottom naming three dissenters.













