Gold is breaking down

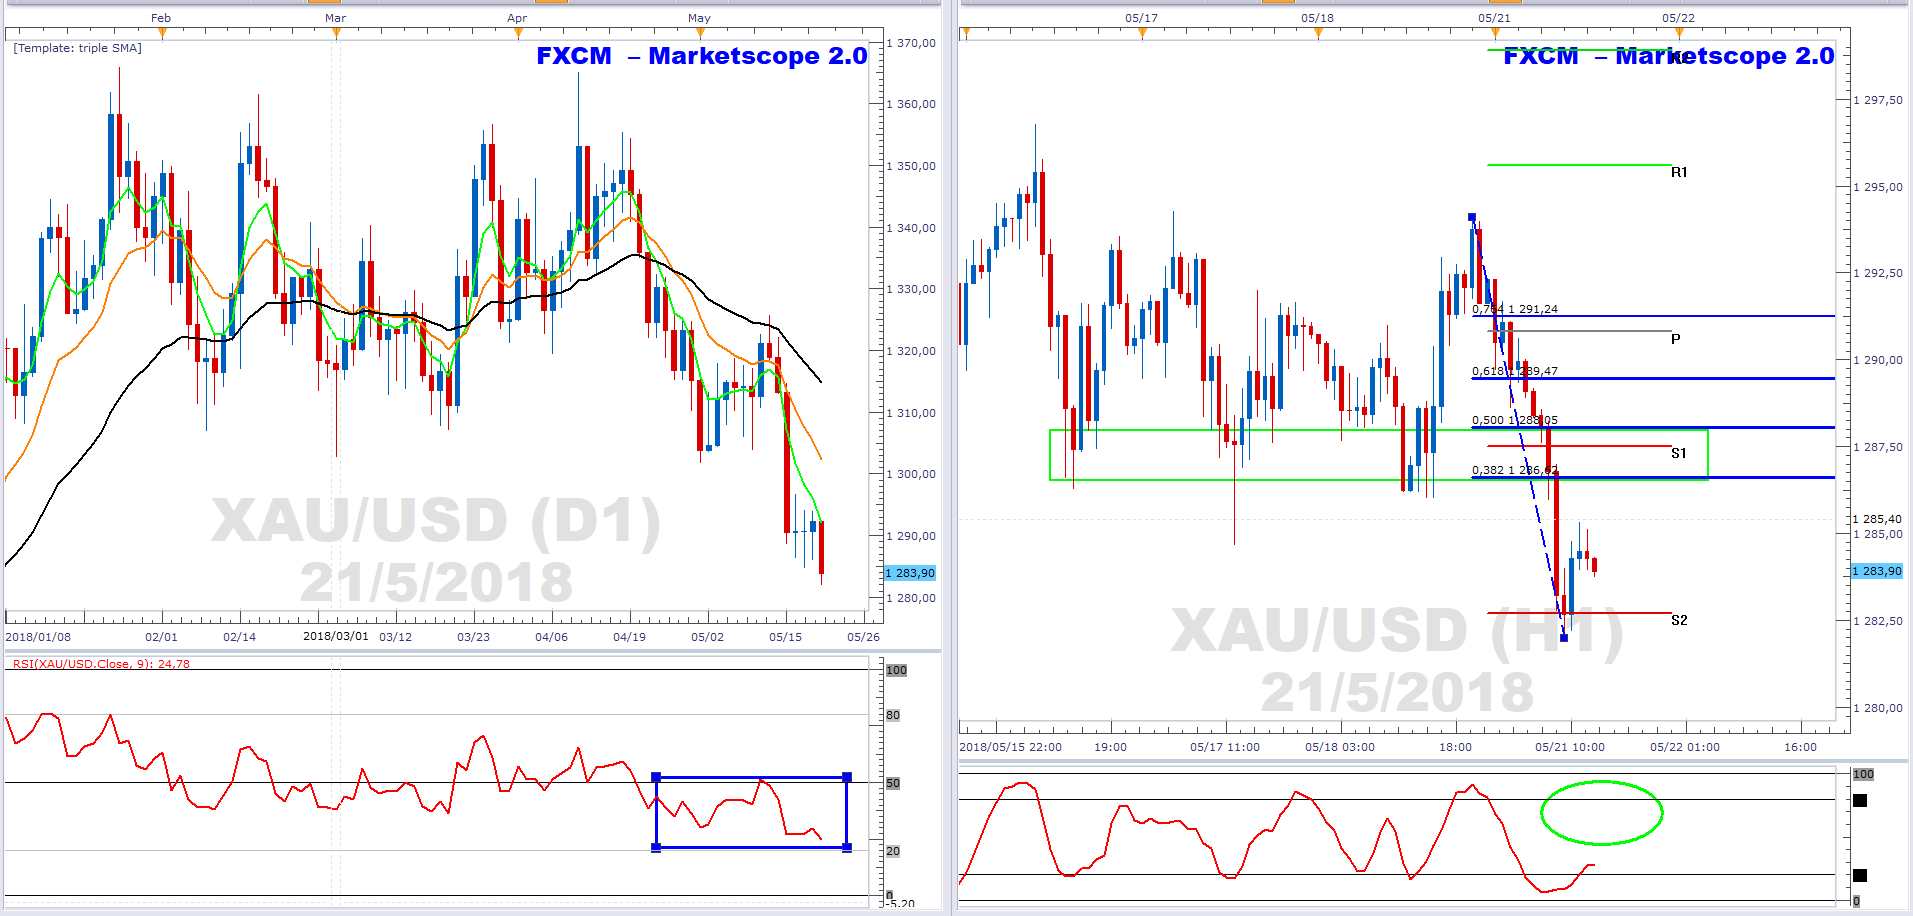
Gold is in a mark-down phase. This phase is typically defined by a bearish EMA formation. I.e. the green 5-day EMA < the orange 13-day EMA < the black 34-day EMA. Moreover, the RSI(9) is below 50 and indicative of bearish momentum (blue rectangle). However, it is also approaching the 20 level, which is regarded as oversold.
Therefore, potential price resistance at a key level with a confluence of factors including the S1 pivot level, price resistance (green rectangle); and the 38.2%-50% Fibonacci retracement area. The stochastic is still to move to an overbought reading (green ellipse).
Gold is inversely related to the USD. The high yields are pushing money into the USD to the detriment of gold. The strong US retail numbers that were released last Tuesday acted as the catalyst for the breakdown.
Author

Russell Shor (MSTA, CFTe, MFTA) has an Honours Degree in Economics from the University of South Africa and holds the coveted Certified Financial Technician and Master of Financial Technical Analysis qualifications from the Interna


