Gold in the week of the cut

Fed’s cut is approaching – but will gold really rally after it?
USD Index holds support zone
I’ve previously written that gold may confirm its breakout, and unless anything major happened in other markets, this would be a bullish sign. I’ve been waiting to post today’s analysis for the market open, as I wanted to check what type of action would prevail after investors had the chance to cool down their emotions. Nothing’s happening so far in the precious metals sector, while the USD Index moved lower. This is a bearish factor, but before concluding, let’s investigate further.
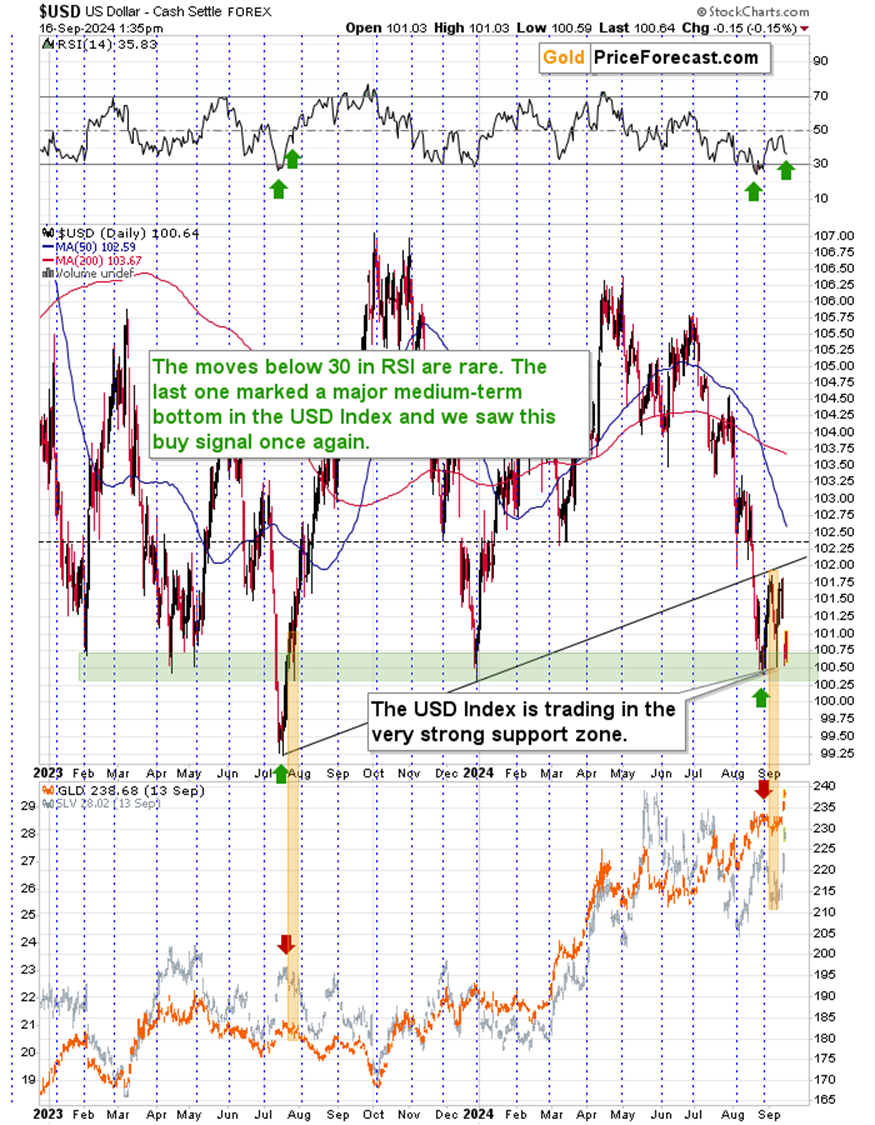
The USD Index is in the support zone that is held throughout 2024 and 2023. There was only one breakdown below it and it was immediately reversed and followed by a huge rally.
The key points from the above chart are:
- The USDX did not break below the support zone, so it continued to support higher USD Index values in the following weeks.
- We recently saw an exceptionally strong buy signal from the RSI indicator .
Looking at the above chart also provides one more interesting takeaway – perhaps THE takeaway.
While gold has been in a particularly strong uptrend between February and April this year, during the rest of the year, gold’s gains were mostly dollar’s declines. In particular, what we have seen since August – gold is rallying as the USD Index is sliding.
And… The thing is that based on the above chart and other charts, the USD Index is about to stop sliding and start rallying.
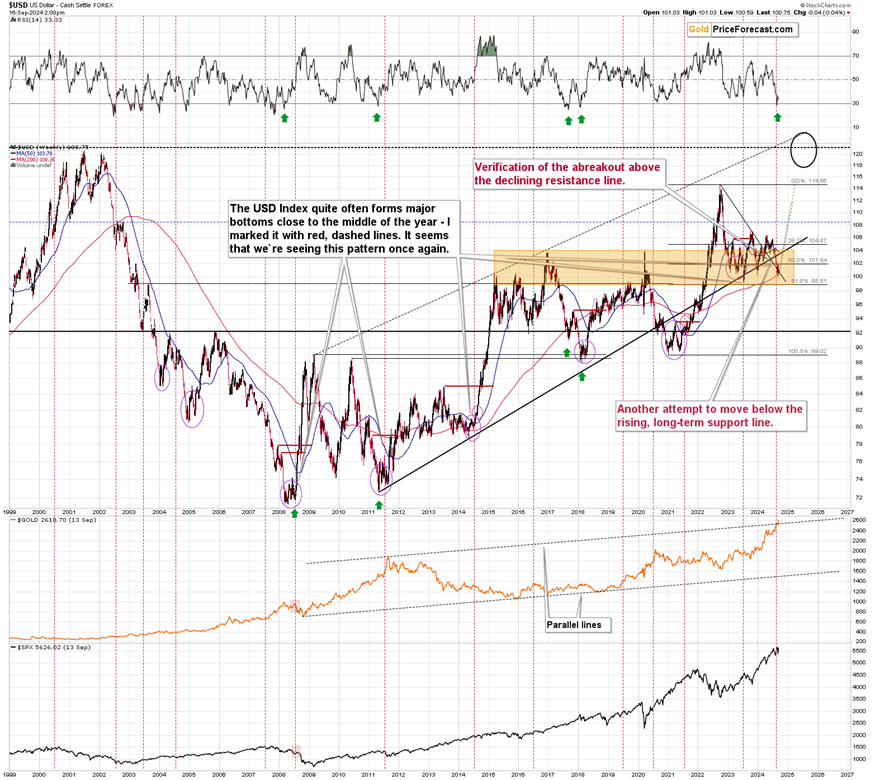
From the medium-term point of view, the USD Index is in the support zone (marked with orange) as well – a much broader one.
The USDX is after a breakdown below the rising black resistance line, which is likely to be invalidated, just as it was invalidated in each previous case.
The RSI based on weekly prices also flashed a very strong buy signal, and I marked the last four cases when we saw it with green arrows. In three out of those four cases, a very strong rally followed, and in the remaining case, a sizable rally followed as well. In most cases (except 2011), gold declined along with the rally in the USD Index.
Today’s reaction in gold the opposite to this – it’s doing nothing despite USD’s decline, suggesting that it’s unlikely that gold would ignore USD Index’s rally like in 2011. It’s likely to decline as the USD Index rallies.
What could be the trigger for that?
Enter interest rate cut.
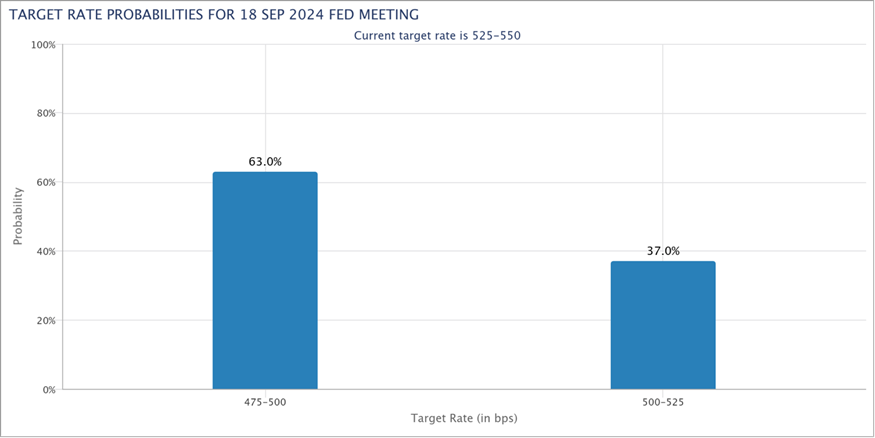
It’s just two days before the next rate cut, and the markets are mostly (63%) betting on a cut of 0.5% instead of a regular 0.25% cut. I find this irrational, as we have no major problems in the stock market. In theory, the Fed could do anything, but in practice, bigger cuts are pretty much reserved for situations when “it hits the fan”.
And are we witnessing plunging stocks?
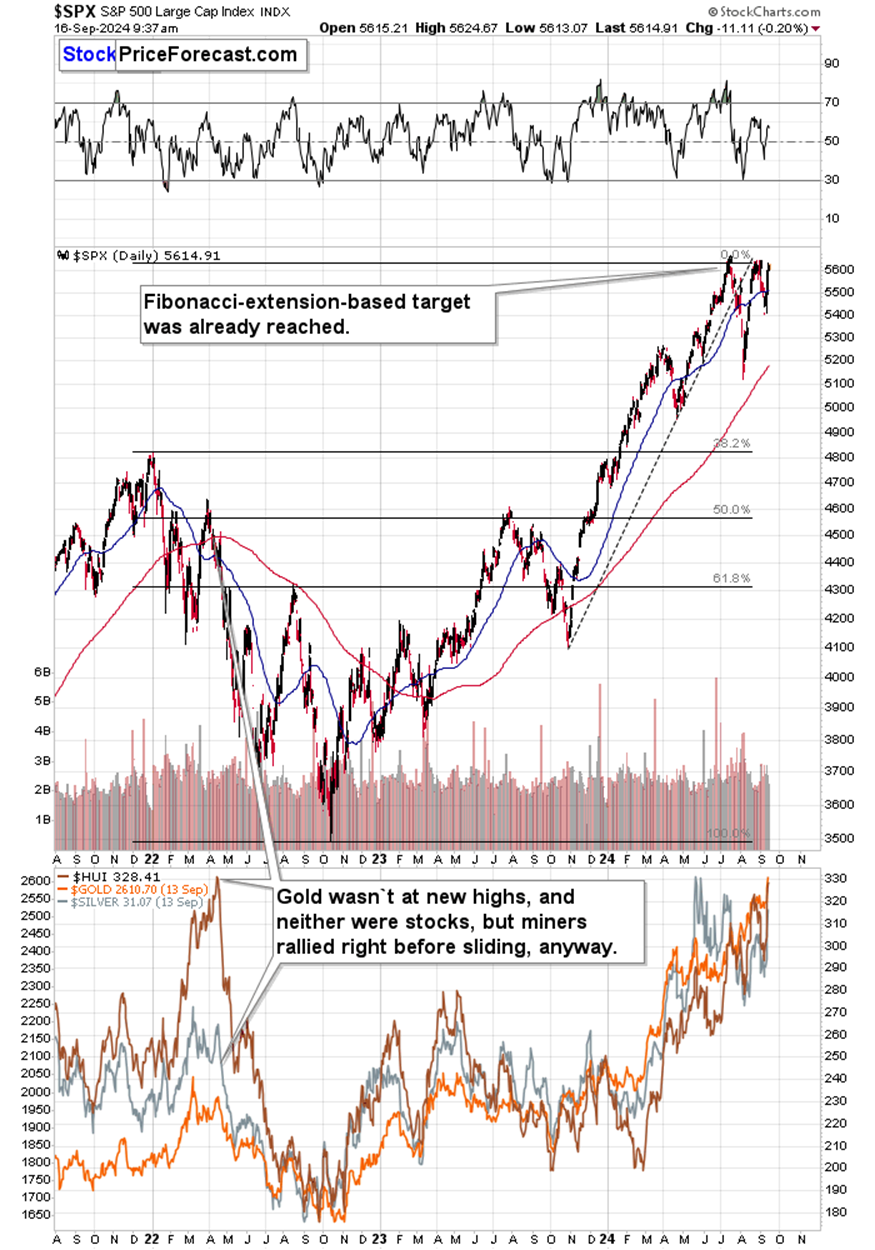
No. Stocks are trading close to their all-time highs. In this case, why would the Fed waste its ammunition?
“Buy the rumor, sell the fact” expected
Also, have you noticed that the “buy the rumor, sell the fact” behavior has become the norm on the forex market? The markets react opposite to what makes fundamental sense after a given announcement.
After the Bank of Japan hiked rates, the yen tumbled (and hiking rates is bullish for the value of a given currency – in general).
After the ECB lowered rates, the euro rallied (and cutting rates is bearish for the value of a given currency – in general).
Now, we’re about to see a rate cut, and the previous chart shows why the “buy the rumor, sell the fact” kind of reaction is likely to take place – people are expecting a bigger hike that is actually likely.
Consequently, we can indeed expect a rally in the USD Index based on the technical grounds and based on what seems likely given the approaching rate cut.
One more thing regarding the forex market. The USD/YEN currency pair – likely the most important for the precious metals sector – moved lower once again but reached a combination of support levels unheard of before (at least not recently).
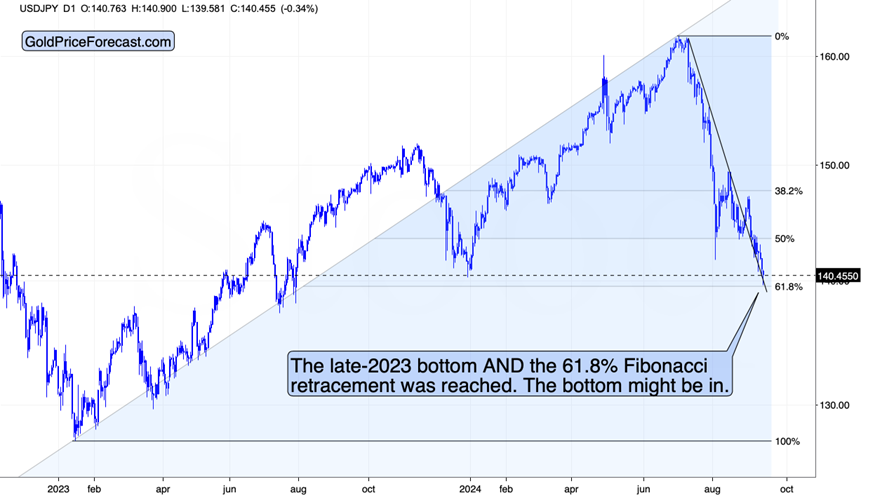
That’s the combination of the late-2023 bottom and the 61.8% Fibonacci retracement level.
The former is a bit higher, and the breakdown below this level has not been confirmed yet. In fact, at the moment of writing these words, the USD/YEN is back above this bottom once again – after touching the 61.8% Fibonacci retracement. This is a perfectly bullish setup, especially since the USD/YEN is after such a dramatic decline in recent months.
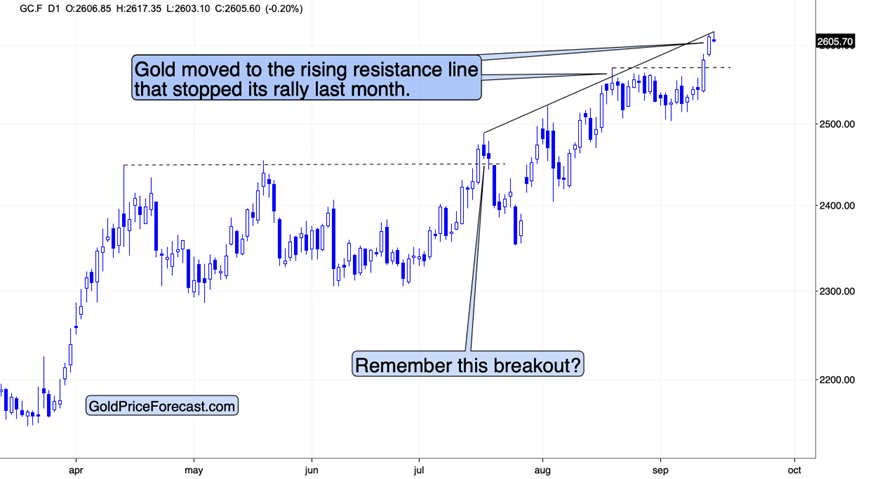
Gold futures are slightly down today after once again touching the rising resistance line that stopped the rally in August.
Today is the third trading day after the breakout, and as you can see on the above chart, the previous breakout was invalidated on the fourth day after it – in a major way.
Given the situation regarding interest rates and currency markets, it wouldn’t surprise me to get the slide and invalidation on the fifth (Wednesday) or sixth (Thursday) day after the breakout.
Want free follow-ups to the above article and details not available to 99%+ investors? Sign up to our free newsletter today!
Want free follow-ups to the above article and details not available to 99%+ investors? Sign up to our free newsletter today!
Author

Przemyslaw Radomski, CFA
Gold Price Forecast
Przemyslaw Radomski, CFA (PR) is a precious metals investor and analyst who takes advantage of the emotionality on the markets, and invites you to do the same. His company, Sunshine Profits, publishes analytical software that any


