Gold has been in a downtrend since 2011

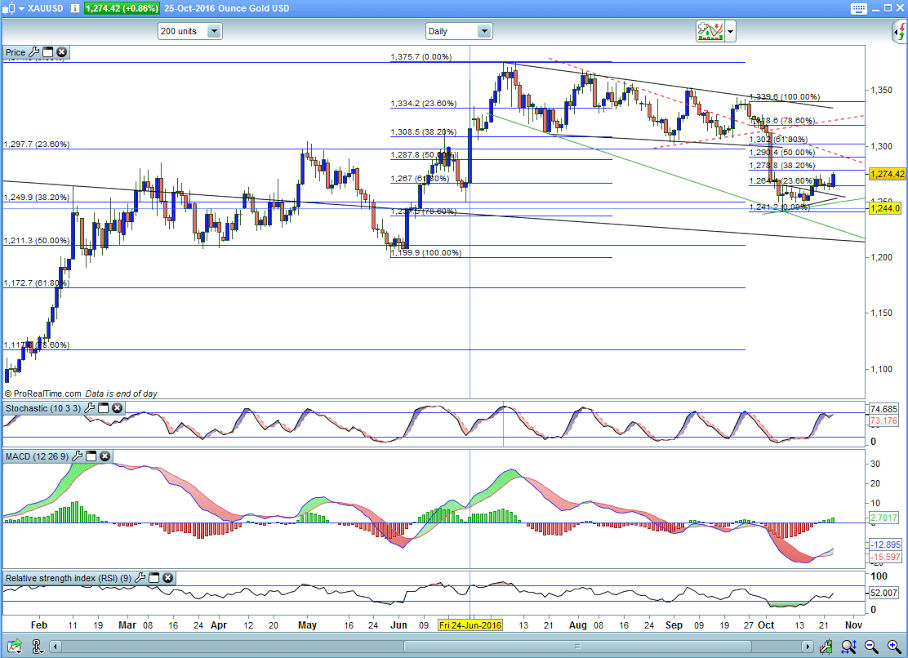
SUPPORT: 1267/65 1262 1250/49 1241** 1238 1226 1222/18 1201/1199
RESISTANCE: 1275 1278 1282 1293/95 1298/99 1304 1310
OK....lets look at Gold now...we saw the break lower to 1241...just below the 1247 38.2 longer term Fib...but also trendline support from the weekly charts....So although Gold looked like it was in freefall and actually moved 130 $ there were buyers in the madness and this shone through as the market held specific technical levels...Now the other point to note is trends...Gold has been in a downtrend since 2011.....and the move from 1045 to 1375 failed to breach the long term monthly 38.2 Fib which was located at 1380....aqre you confused yet....My point is the long term 2011 downtrend saw a correction back to 1375...It did not make a dent in the overall trend...and when we fell very sharply fom 1375 to 1241 we only retraced 38.2 of the shorter term trend...so this is what we have currently....we have a good chance to trade higher from her....IF we can break the 38.2 med term fib at 1278....This really does need to break to keep the buyers happy and not give way to long term sellers....and please believe me...there was long term sellers up at 1375.....It didn't fall 130$ on nothing...ok..the market was long down at the 1310/04 area...still...that's a pretty big move...even for Gold..over such a short period of time....but Gold does trade like that....it behaves itself for long periods of time....then bang...it moves 50$ in a day....that's the natural behaviour of Gold since the break out of 2001....I have traded Gold many times over many years and it can still surprise me....I do not believe it is a day traders market...its much more of a positon takers...which is why it can move with a lot of volatility..so where now....well above 1278 and there is no reason we cannot go back towards the 1295/99 area....This was the break point on the downside...so would be a natural retracement target.....Also if we extend the recent consolidation base trendline we can see also that it comes in at 1296...so this area is a viable target.....stochastics are pointing higher..still....but once more we have to get above 1278...Failure will put pressure back on the downside and we could then be looking at another attempt at 1255 which is actually the top trendline from the recent small pennant we saw formed...so there is a argument for both sides....I know you all probably do not look at the longer term timeframes of monthly charts...but trading markets you do need to know where the big levels are...where the actual Gold traders will take it...and as we know in a strong trend we can usually retrace 38.2 of that whole mve...and this we saw on the rally to 1375....so please bear these long term levels in mind...it is impossible to trade markets and not know where your primary ..secondary and minor trends are and you do not get these from a 5 min bar chart...do the homework....put the hours in....it will pay you in the long run.
Interested in XAUUSD technicals? Check out the key levels
Author

Carol Harmer
Charmer Trading
Carol Harmer has over 39 years experience of analysing and trading the world's markets and is undoubtedly one of the most respected technical trader in the world today.


