Gold Elliott Wave technical analysis [Video]
![Gold Elliott Wave technical analysis [Video]](https://editorial.fxsstatic.com/images/i/Commodities_Gold-1_XtraLarge.jpg)
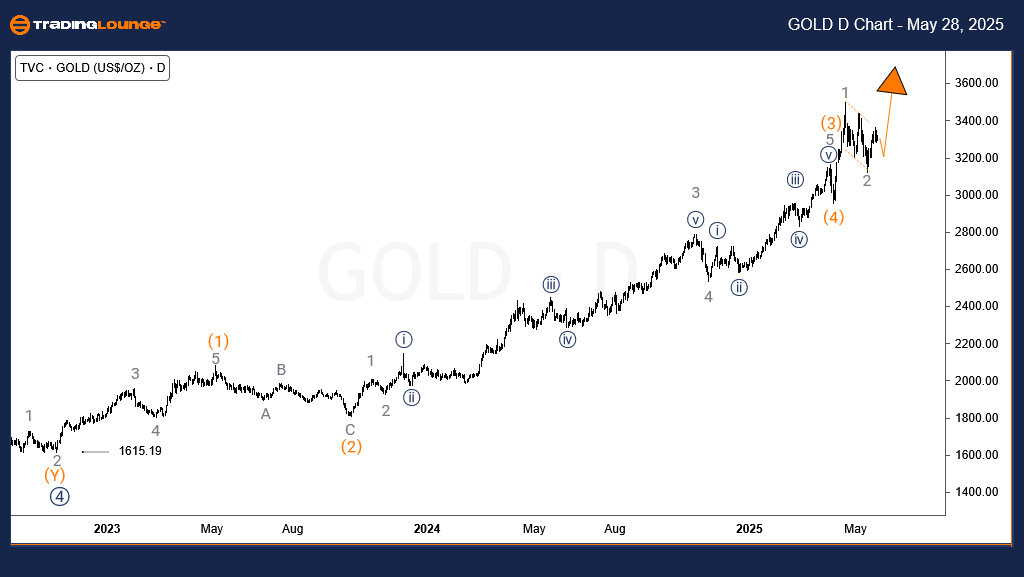
Gold – Daily chart analysis
The long-term uptrend began in October 2022, marking the end of the primary wave ((4)) and the beginning of wave ((5)). At that time, Gold traded near $1615. Since then, the market has completed intermediate waves (1), (2), (3), and (4) of the ongoing primary wave ((5)). The current movement represents wave (5) of ((5)), which is projected to conclude the broader uptrend that started in October 2022.
Recent price action suggests that wave (5) remains incomplete. The pullback observed between April 21 and May 14 appears to be wave 2 of (5). The rally currently underway corresponds to wave 3 of (5), and if momentum continues, it could lead to a breakout toward a new high near the 3996 level.
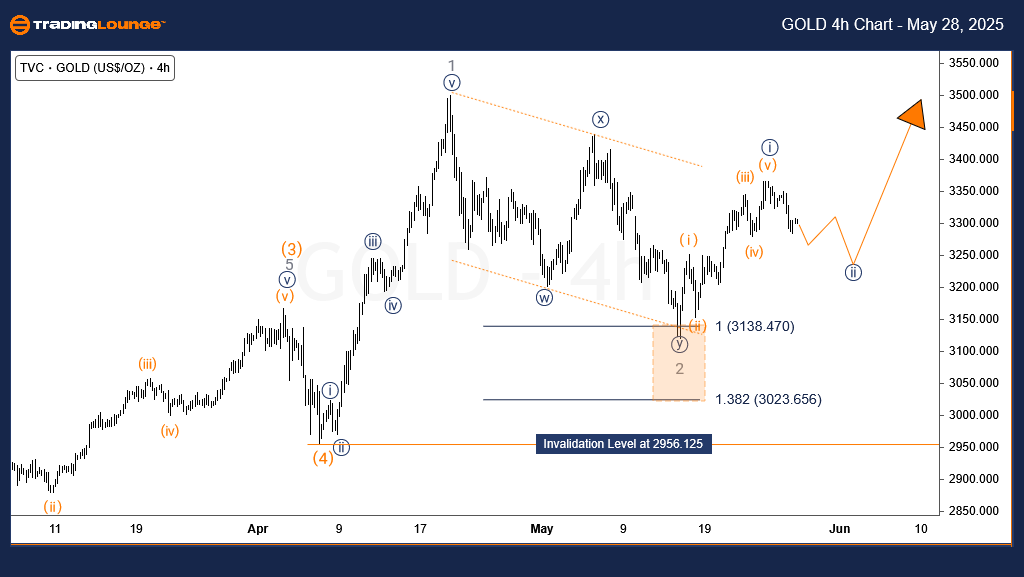
Gold – Four-hour chart analysis
On the H4 timeframe, wave 3 of (5) is unfolding. Within this structure, wave ((i)) appears to have concluded, and a continuation is expected following the dip in wave ((ii)). Assuming the 3120.21 level, which marked the low of wave 2, remains unbroken, wave ((iii)) could deliver the next major rally leg within this bullish impulse.
Conclusion
The Elliott Wave structure continues to favor the bullish scenario. As long as key support levels hold, the market is likely to push toward the next target near 3996, offering further trading opportunities.
Gold Elliott Wave technical analysis [Video]
Author

Peter Mathers
TradingLounge
Peter Mathers started actively trading in 1982. He began his career at Hoei and Shoin, a Japanese futures trading company.


