Gold Elliott Wave technical analysis [Video]
![Gold Elliott Wave technical analysis [Video]](https://editorial.fxstreet.com/images/Markets/Commodities/Metals/Gold/gold-coins-on-a-weight-scale-gm173237086-20246712_XtraLarge.jpg)
Gold Elliott Wave analysis
Function - Trend.
Mode - Corrective.
Structure - Likely Zigzag.
Position -Wave C of (4).
Direction - Wave C of (4) is still in play.
Details - Gold fell sharply on Friday to show the end of Wave B and the start of Wave C which could extend lower before Wave 5 begins upside.
Gold experienced a sharp decline last week following reports from China and strong US job numbers. The recovery seen in the first week of June has been completely eroded, suggesting the commodity may head lower in the short term. However, despite this downturn, Gold remains in a bullish trend. The fall from the May 20th high of 2450 is still considered corrective, indicating that the bullish trend should resume.
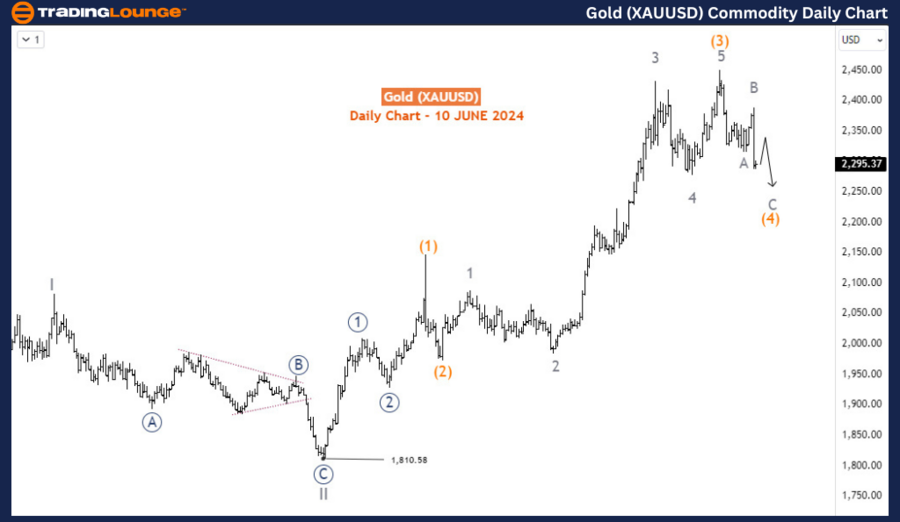
Daily chart analysis
The daily chart shows that the intermediate wave (3) concluded at 2450 with an expanding diagonal structure. Since reaching this high, Gold has been in a corrective phase. Typically, the fourth wave (wave (4)) corrects up to 38.2% of the third wave (wave (3)) and can sometimes approach the 50% retracement level. It usually does not surpass this level; otherwise, it could signify a different wave structure. In this scenario, Gold could decline in wave (4) to 2269, which represents the 38.2% retracement of wave (3), or even further to 2213, corresponding to the 50% retracement level.
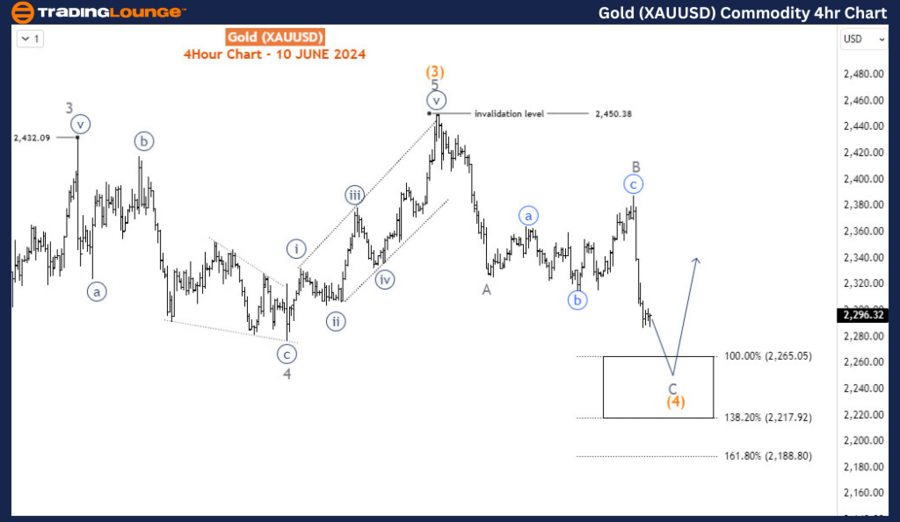
Four-hour chart analysis
On the H4 chart, it appears that wave (4) is forming a zigzag structure. This includes:
-
An impulse wave for wave A.
-
An expanding flat for wave B.
-
Another impulse likely to complete wave C.
In a zigzag pattern, wave C often extends to 100-138.2% of the Fibonacci projection of wave A from B. These levels are at 2265-2217, aligning closely with the 2269-2213 retracement projections mentioned earlier for wave (4). We anticipate wave (4) will end around these levels, setting the stage for wave (5) to begin as buyers push the price toward a fresh high in the ongoing bullish trend.
Summary
Gold's sharp decline last week, influenced by external economic reports, suggests a potential for further short-term weakness. Nonetheless, the overall bullish trend remains intact. The daily chart indicates that Gold is in the corrective wave (4), which could see prices drop to the 2269-2213 range, corresponding to the 38.2% and 50% retracement levels of wave (3). The H4 chart supports this view, identifying a zigzag structure in wave (4) that could complete between 2265-2217. Once wave (4) concludes, wave (5) is expected to begin, propelling Gold toward new highs. Traders should monitor the 2269-2213 range for signs of the correction ending and the resumption of the bullish trend.
Gold Elliott Wave technical analysis [Video]
Author

Peter Mathers
TradingLounge
Peter Mathers started actively trading in 1982. He began his career at Hoei and Shoin, a Japanese futures trading company.


