Gold Elliott Wave technical analysis [Video]
![Gold Elliott Wave technical analysis [Video]](https://editorial.fxstreet.com/images/Markets/Commodities/Metals/Gold/raw-gold-55156544_XtraLarge.jpg)
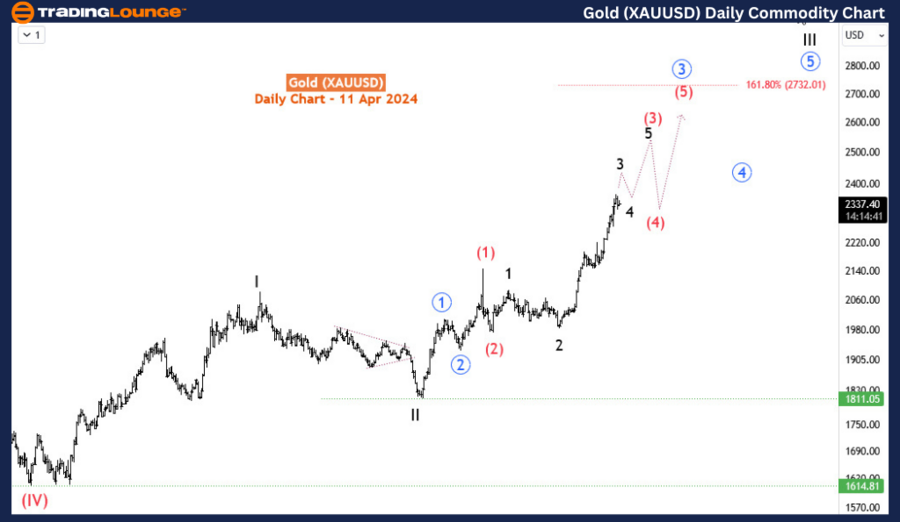
Gold Elliott Wave analysis
Function - Trend.
Mode - Impulse.
Structure - Impulse wave.
Position - Wave (v) of 3.
Direction - Wave 4 pullback.
Details - Expecting wave 4 dip to be followed by further rallies for wave 5. Wave 3 may not have ended yet. The bullish trend is still intact.
Gold's trajectory across all chart timeframes remains decidedly bullish, consistently surpassing previous all-time highs. The current bullish trend commenced in December 2015 following a bearish correction lasting over 51 months from August 2011 to December 2015. Preceding this correction was a bullish impulse spanning over 144 months from August 1999. Furthermore, before August 1999, a bearish correction persisted for 236 months from January 1980, with a preceding bullish trend dating back to the 1970s. Thus, Gold's price exhibits a cyclical pattern characterized by waves of impulse and corrective cycles. The ongoing impulse cycle has endured for just over 100 months, suggesting that historically, this bullish trend has yet to reach its conclusion.
In today's commodity blog post, we will meticulously analyze the current bullish impulse cycle from 2015.
On the daily chart, the current impulse cycle corresponds to the supercycle wave (IV). Presently, we find ourselves in the cycle degree wave III of (IV). Based on the Fibonacci projection, wave III has the potential to extend to the 161.8% projection of wave I from II, reaching a level of 2732. This serves as a long-term target for Gold enthusiasts. Currently, the price resides in wave 3 of (3) of blue wave 3 of III. As there are still several waves pending completion before reaching the projected target, the next buying opportunity is anticipated after wave 4, given that wave 3 is nearing its fulfillment.
Transitioning to the H4 timeframe, wave 3 is nearing completion, particularly the final leg denoted as wave (v) of blue wave v of 3, after breaking above the 2300 medium level. The price currently oscillates between the 2300 and 2500 medium levels. If indeed wave 3 is concluding its final phase, a pullback for wave 4 is expected around the 2300 level before further rallies for wave 5 towards 2500. Consequently, buying the dip of wave 4 is advisable, particularly if it retreats to the 2300 level. By adhering to these guidelines, traders can effectively capitalize on Gold's ongoing bullish momentum while navigating the market with precision.

Gold Elliott Wave analysis [Video]
Author

Peter Mathers
TradingLounge
Peter Mathers started actively trading in 1982. He began his career at Hoei and Shoin, a Japanese futures trading company.


