GOLD

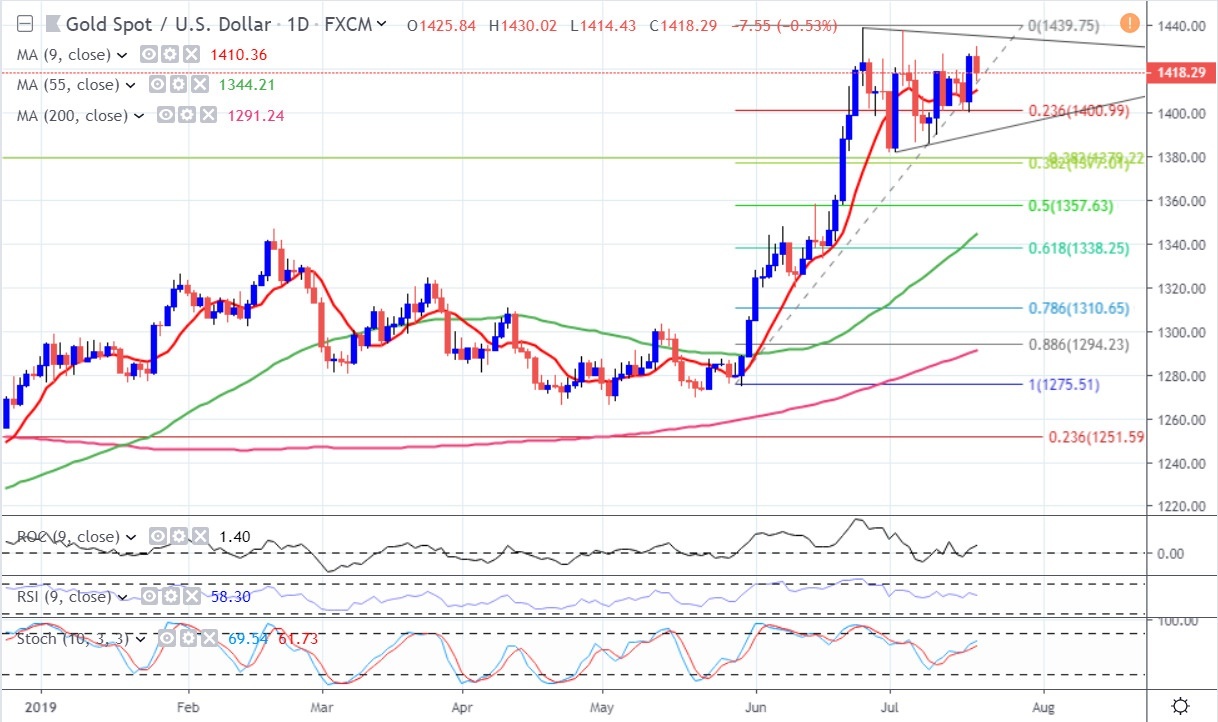
Gold has made a DT at 1437/39....now what we are seeing currently is the Gold has come down...to the break point..near enough....and has now traded sideways...The pattern is a bullish pennant....these are continuation patterns....and after Golds run up from 1275 it needed a continuation pattern to slow things down....to take a breath...Now there are measured targets from this pattern...the initial on is the highest point of the pattern...1439...to the lowest 1381...you subtract 1381 from 1439 leaving you with a 58$ differential... Now...add 58$ onto the break of the pattern...In this case 1439...and what do we get...1497...Now this is the minimum measured target....what in reality we are taught is that the length of the pole can be a measured target also..so we do the sums again...this time taking it further apart...thus...1439 minus 1275 = a 164$ move...add 164 onto 1439 and you get a long term target of 1603....Now..before you all have a fit...remember...we have come up from 1275 end of May....sooo to break to 1603 within the next couple of months is not out of the question...The really important point to note about Gold is this...it was in a major uptrend...only since 2013 have we traded sideways....weve broken that....we returned to the break point thus giving you another chance to go long...got out of breath...having a bit of a rest...then off we go again...now is can stay in this continuation sideways band for only another few weeks ..max...continuation patterns are quicker than topping patterns....topping patterns take longer to form...so stay within the defined lines Iv drawn..trade the range..ready to buy the break

Gold

The research provided by Charmer Charts is provided solely to enable clients to make their own investment decisions and does not constitute personal investment recommendations. No recommendations are made directly or indirectly by Technicalanalysisreports.com or Charmer Charts as to the merits or suitability of any investment decision or transaction that may result directly or indirectly from having viewed the technical analysis investment research. Customers are therefore urged to seek independent financial advice if they are in any doubt. The value of investments and the income derived from them can go down as well as up, and you may not get back the full amount you originally invested. Derivatives and foreign exchange trading are particularly high-risk, high-reward investment instruments and an investor may lose some or all of his or her original investment. Also, if you decide to acquire any investment denominated in a different currency you should note that changes in foreign exchange rates may have an adverse effect on the value, price and income of the investment in your own currency. Technicalanalysisreports.com or Charmer Charts shall not be liable for any direct or indirect, incidental or consequential loss or damage (including loss of profits, revenue or goodwill) arising from the use, inability to use, interruption or non-availability of the technical analysis investment research or any part of the research materials published or otherwise any loss of data on transmission, howsoever caused. Whilst the research material published is believed to be reliable and accurate, it is not independently verified. Accordingly, no representation or warranty is made or given by Technicalanalysisreports.com or Charmer Charts, its officers, agents or employees as to the accuracy or completeness of the same and no such person shall have liability for any inaccuracy in, or omission from, such materials.

Recommended Content


Recommended Content

Editors’ Picks

EUR/USD climbs to 10-day highs above 1.0700

EUR/USD climbs to 10-day highs above 1.0700

EUR/USD gained traction and rose to its highest level in over a week above 1.0700 in the American session on Tuesday. The renewed US Dollar weakness following the disappointing PMI data helps the pair stretch higher.

EUR/USD News

GBP/USD extends recovery beyond 1.2400 on broad USD weakness

GBP/USD extends recovery beyond 1.2400 on broad USD weakness

GBP/USD gathered bullish momentum and extended its daily rebound toward 1.2450 in the second half of the day. The US Dollar came under heavy selling pressure after weaker-than-forecast PMI data and fueled the pair's rally. 

GBP/USD News

Gold struggles around $2,325 despite broad US Dollar’s weakness

Gold struggles around $2,325 despite broad US Dollar’s weakness

Gold reversed its direction and rose to the $2,320 area, erasing a large portion of its daily losses in the process. The benchmark 10-year US Treasury bond yield stays in the red below 4.6% following the weak US PMI data and supports XAU/USD.

Gold News

Here’s why Ondo price hit new ATH amid bearish market outlook Premium

Here’s why Ondo price hit new ATH amid bearish market outlook

Ondo price shows no signs of slowing down after setting up an all-time high (ATH) at $1.05 on March 31. This development is likely to be followed by a correction and ATH but not necessarily in that order.

Read more

Germany’s economic come back

Germany’s economic come back

Germany is the sick man of Europe no more. Thanks to its service sector, it now appears that it will exit recession, and the economic future could be bright. The PMI data for April surprised on the upside for Germany, led by the service sector.

Read more

Majors

Cryptocurrencies

Signatures