Gold correction, Crude Oil momentum and S&P topping signals

As global markets navigate shifting macro conditions and technical turning points, key assets are presenting distinct trade setups. Gold is undergoing a healthy correction with bullish potential emerging near key order blocks. Crude Oil (WTI) continues its upward momentum, fueled by strong fundamentals and a technical gap that may drive price toward higher targets. Meanwhile, the E-mini S&P is showing signs of exhaustion, with a potential short-term top forming near recent highs. This cross-asset snapshot highlights critical levels and directional bias to watch in the coming sessions.
Gold (XAU/USD)
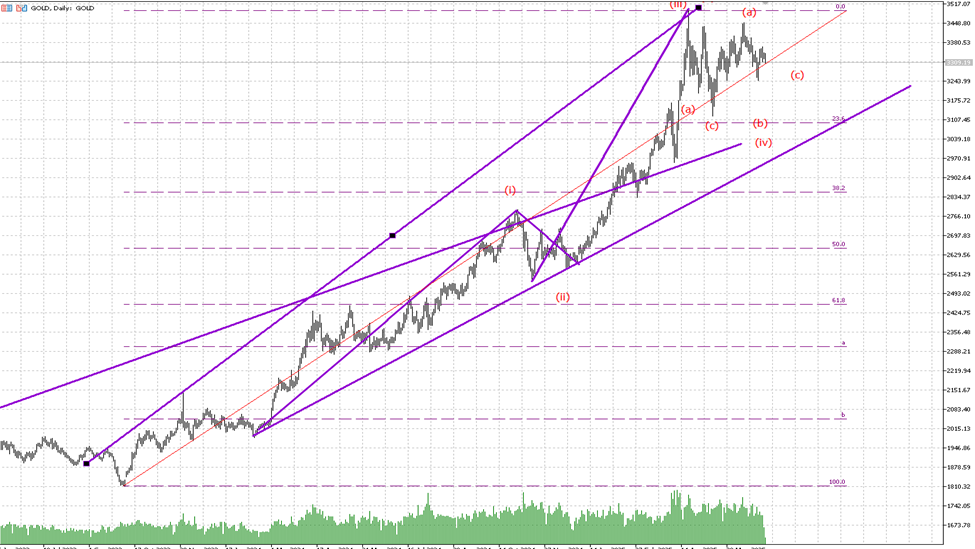
Gold appears to have completed its impulsive Wave (III) at the 3517 high and is now entering a Wave (IV) corrective phase, forming a classic (a)-(b)-(c) zigzag. Technical confluence across Neo Wave, ICT methodology, Gann angles, and harmonic cycles points to a likely drawdown toward 3107, with deeper projections to 2894—marking key Fibonacci retracement zones.
Technical & Neo wave structure
-
Gold peaked at 3517, marked as a likely Wave (III) of a larger impulsive cycle.
-
Currently undergoing a corrective wave (IV) as a classic (a)-(b)-(c) Zigzag.
-
Subwave on daily basis (c) is likely unfolding now, with downside projections pointing toward 3107 (Fib 23.6%) and deeper correction potential to 2894 (Fib 38.2%).
ICT analysis
-
CHoCH (Change of Character) confirmed near 3430–3450.
-
Sell-side liquidity sweep below 3250 may allow draw on higher timeframe liquidity pools.
-
Fair Value Gaps: 3380–3402 (untouched), 3188–3200 (likely target zone).
-
Key Order Block: 3050–3100. Expect reaction and accumulation near this OB-FVG confluence.
Gann angles and channel structure
-
Short-term steep Gann angle broken.
-
Broader trendline support stands at 2900–2950.
-
Price could consolidate in this Gann zone before the next impulsive leg higher.
Vibration and harmonic cycle
-
Applying musical harmonics (using 3240 as 0° Aries base):
-
The last leg up was a harmonic extension from Mi (2832) → So (3167) → Ti (3432–3517).
-
Price now falling back to harmonic reset zone near Mi (3050).
-
-
A successful retest here aligns with historical vibration support zones and Gann retracement.
Quand and order flow signals
-
Multiple divergence signals (price, delta, body) detected near the 3430–3450 top.
-
Volume thinning as price made higher highs suggests momentum exhaustion.
Fundamental backdrop
-
Central banks (especially BRICS nations) remain net buyers.
-
US Fed expectations shifting toward cuts in H2 2025.
-
Safe-haven flows remain intact amid geopolitical risk.
-
A correction is warranted technically but mid-to-long-term bias remains bullish.
An intraday short position from 3345/3352 targets 3292, with a deeper downside extension possible toward 3265. A potential buying opportunity could emerge mid-week from the 3223/3232 zone, with a protective stop at 3197.
Crude Oil (WTI)
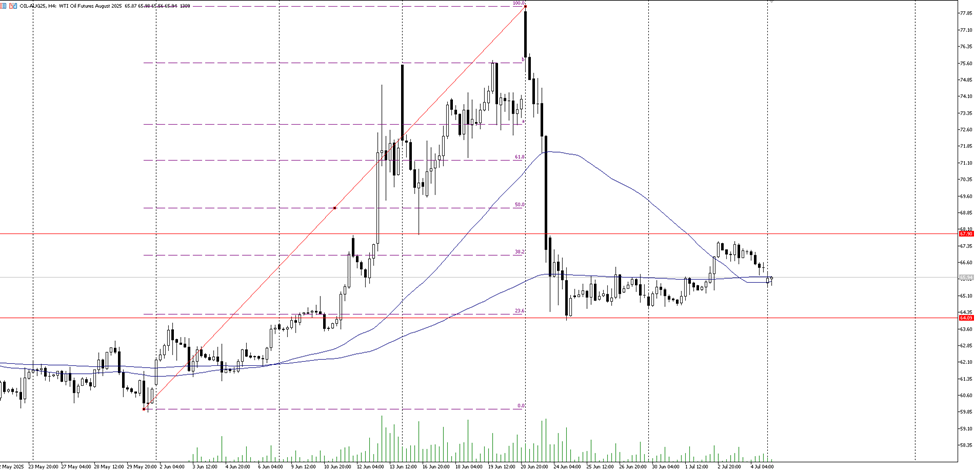
Crude oil is currently trading around $66.00, with a bullish gap still open at 66.45 and upside projections aiming toward 68.12 and 69.80. Price action suggests the market has completed a Wave 2 correction at $64.00 and is now entering a classic Wave 3 acceleration, supported by ICT liquidity structures, a filled Fair Value Gap, and emerging buy-side momentum.
Neo wave and ICT
-
Crude completed Wave 2 correction at 64.00 and is now entering Wave 3 acceleration.
-
ICT Smart Money behavior suggests buy-side liquidity targets post-gap.
-
Fair Value Gap: 64.00–64.60
-
Order Block support: 64.80–65.00
Six sigma analysis
-
Mean: 63.20
-
+1σ: 65.90 (tested)
-
+2σ: 68.12 (projected next)
-
+3σ: 70.00 (potential blow-off top or reversal zone)
-
Crude is now operating within a +1σ to +2σ expansion phase. Mean reversion expected post-68.12 or 69.80 spike.
Vibration zones
-
Current swing from 61.50 to 68.12 is a Ti harmonic vibration extension, possibly heading to the upper octave if volume supports.
-
We wait to buy once Gap is filled or wait for the market to forms its bottom around 65.00-ish area
Macro-fundamentals
-
China’s restocking demand and US hurricane disruptions providing near-term support.
-
Strategic Reserve rebalancing and OPEC+ compliance in focus.
-
Bullish structure sustained as long as price holds above 64.50
With current movement between +1σ and +2σ expansion bands, and vibration zones aligning near 68.12, short-term spikes may test upper harmonics before reverting to the mean. Macro support from China’s demand recovery, U.S. hurricane risk, and OPEC+ compliance continue to underpin the bullish bias — as long as $64.50 holds firm.
E-Mini S&P 500 (ES futures)
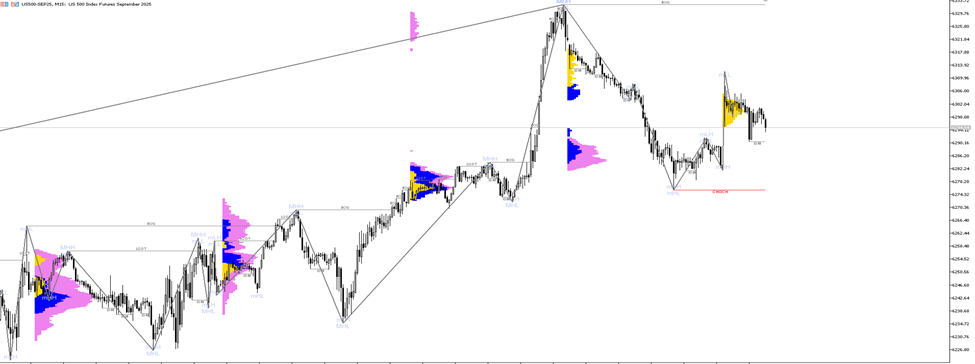
The index is currently trading around 6298, after hitting a day high of 6312—a level now tested thrice, hinting at upside exhaustion unless volume confirms a breakout above 6335–6349. Technical structure shows signs of weakening momentum with divergent delta, narrowing candle body ranges, and a potential CHoCH formation on a break below 6275.
Technical and ICT observations:
-
Recent triple tap at 6312 hints at exhaustion unless broken convincingly.
-
CHoCH (Change of Character) forms if 6275 breaks.
-
Key FVG lies between 6242–6238, possible intraday retracement zone.
-
Order Block support: 6180–6200
Vibration harmonic cycle
-
The rally from 6120 aligns with harmonic sequence: Do → Re → So → Ti
-
Current level (6312) is a minor harmonic overshoot.
-
A retracement to So/Mi vibration range of 6024–6060 is possible if rejection follows.
Quand and delta readings
-
Quands triggered at 6310: Price making higher highs while delta diverges and body range contracts.
-
Suggests a trap move or fading opportunity unless high volume breaks above 6335.
Six sigma envelope
-
+2σ: 6320 (hit today)
-
Mean: 6222
-
Risk of mean reversion increases if sellers appear below 6285.
-
Re-test zone: 6180 (Order Block + FVG)
-
We are expecting a top near 6349 for today and may extend to 6400 from possible correction take this down to 6224 ish area
Fundamental drivers
-
Positive NFP and strong tech earnings lifted the index.
-
AI sector remains in rotation leadership.
-
Fed’s policy outlook remains in flux; markets expect no hike, possibly one cut in late 2025.
-
Geopolitical risk and US elections pose macro headwinds for sustained rallies.
|
Asset |
Price |
Trend |
Key Zones |
Bias |
|---|---|---|---|---|
|
Gold (XAU) |
3320 |
Correction |
3272, 3202, 3175 OB |
Bullish after pullback |
|
Crude Oil |
66.00 |
Bullish |
66.45 gap, 68.12, 69.80 |
Upside after gap fill |
|
E-mini S&P |
6298 |
Topping |
6312 high, 6258 FVG, 6180 OB |
Short-term correction risk |
Gold (XAU) remains bullish after a pullback, with key demand zones at 3272, 3202, and 3175 likely to attract buyers. Crude Oil holds a bullish outlook, with momentum expected to accelerate following a gap fill at 66.45, targeting 68.12 and 69.80. Meanwhile, the E-mini S&P is showing signs of topping near 6312, with short-term correction risk rising—especially if price fails to hold above the 6258 fair value gap and 6180 order block.
Author

Faysal Amin
Mind Vision Traders
Faysal Amin is a seasoned financial analyst and market strategist with over a decade of experience in global markets, including equities, forex, and commodities.


