Gold, Chart of the Week: XAU/USD bulls need to hold $1,850 or a 61.8% golden ratio will be next on bear's menu
- The $1,850 level is an important support level for the week ahead.
- The bears and bulls are battling it out for control and the next moves on the 4-hour and 1-hour time frames will be key.

Gold found some support on the last trading day of the final week of May's business which could be a spanner in the works for those that are positioned short and in pursuit of a deeper correction of the prior bullish daily impulse.
As per last week's analysis, Gold, Chart of the Week: XAU/USD bulls take charge to challenge critical resistance, the price moved in on the resistance but was met by subsequent supply that, in accordance to the daily W-formation, sent the market lower towards the neckline of the pattern. The following multi-timeframe analysis illustrates the current market structure and concludes that bulls need to hold the 1,850 level or risk hungry bears taking over again.
Gold, weekly chart, prior analysis and live market

It was stated in last week's pre-open analysis that there were ''prospects for a deeper correction of the weekly bearish impulse in order to mitigate the price imbalance on the four-hour chart towards $1,858. Thereafter, a 38.2% Fibo of the weekly impulse is located at 1,867.''
The bulls achieved the 38.2% with some change, scoring a high of $1,869.75.
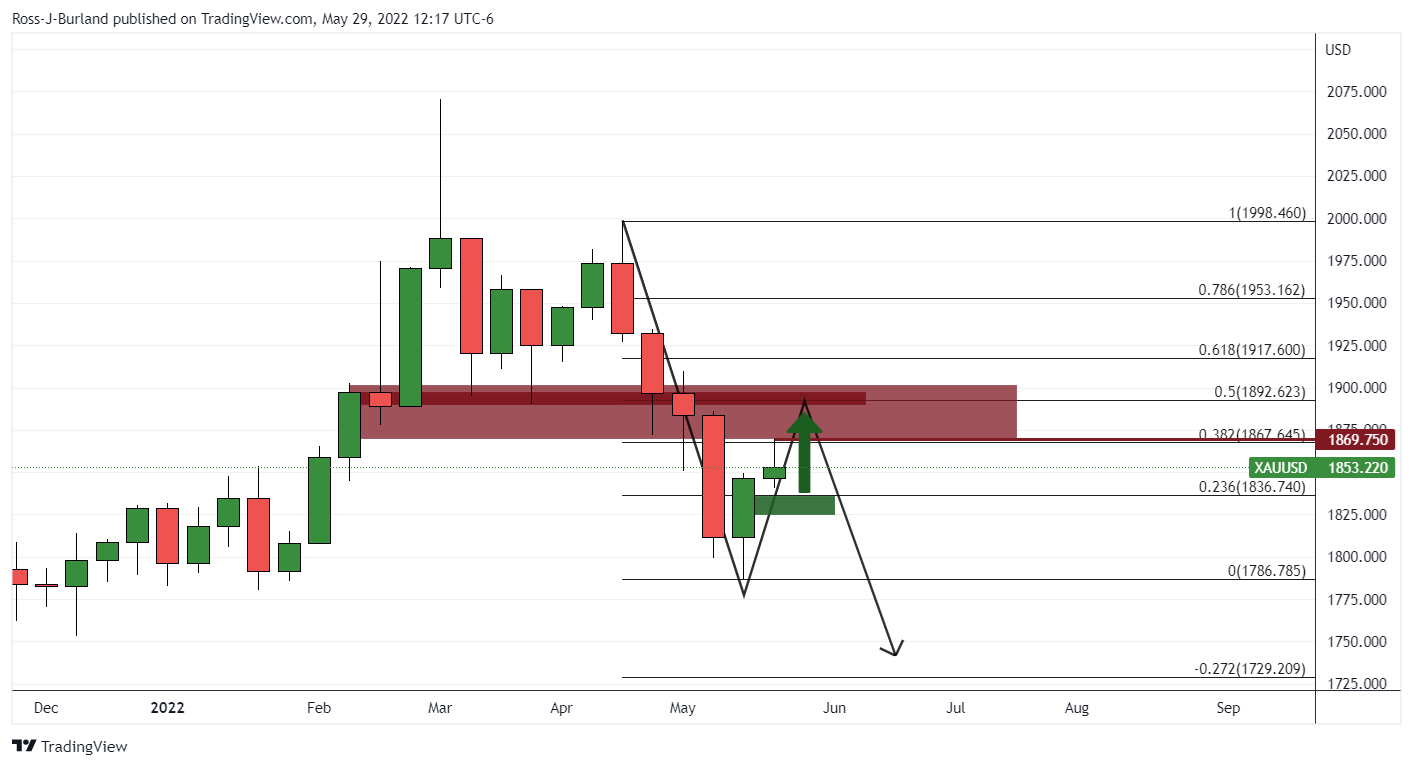
At the juncture, while there is the possibility that the 38.2% Fibo is as far as the bulls will manage to take this, the 50% mean reversion target near $1,893 is still to play for. Last week's bull candle shows that the bears moved in to protect higher levels, but given the bulls remained in charge overall, there are still prospects for a move higher prior to a break of the weekly lows of $1,786.79.
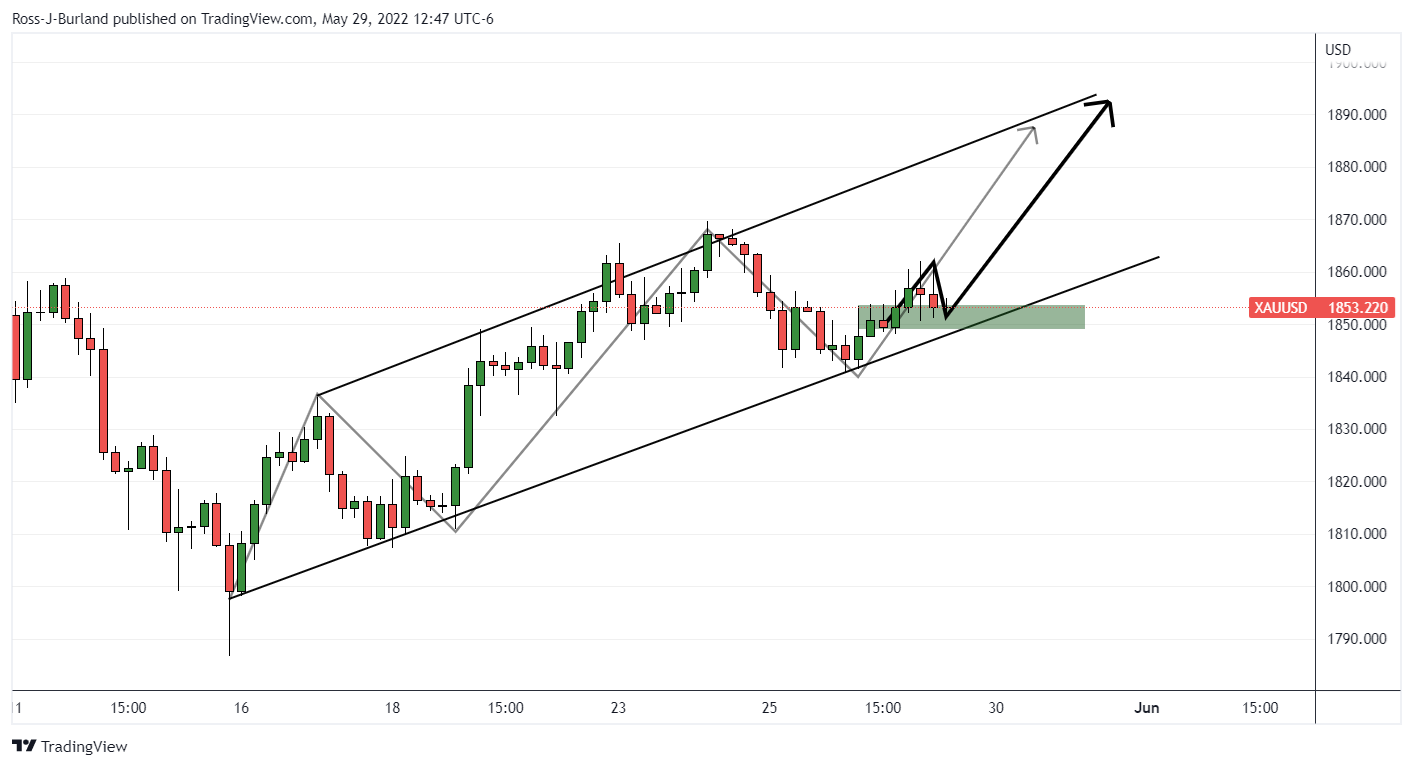
Gold, daily chart, prior analysis and live market

The prior pre-open analysis from last week identified the reversion pattern as above:
''The price has carved out a W-formation. This is a reversion pattern and the price would be expected to restest the neckline in due course. However, a break of the resistance near $1,860 will be needed to open the pathway toward the 50% mean reversion target on the weekly chart for the days ahead.''

As illustrated here, the price penetrated the resistance, moved lower towards the neckline in a 38.2% correction and firmed which leaves prospects of a bullish continuation on the cards for the days ahead.
However, one does not simply buy but needs to see bullish price action and structure forming on the lower time frames and this is where the current scenario is conflicting.
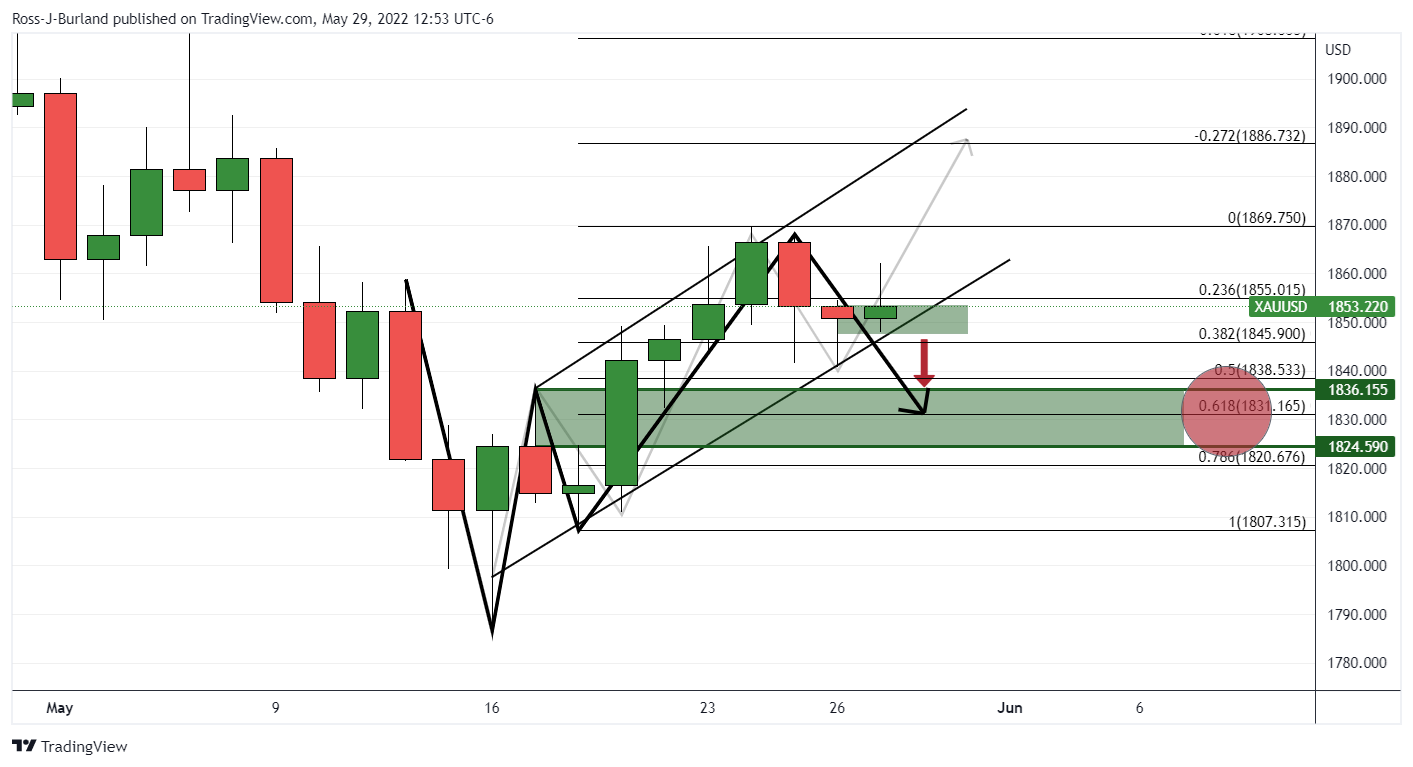
Gold, H4 and H1 charts
There is a bullish structure here around the psychological $1,850 round number on the four-hour chart from which bulls could well engage from in the open. Should the bulls commit, then the 50% weekly target will be eyed.
However, the daily chart's W-formation's neckline near a 61.8% golden ratio is yet to be fully tested:
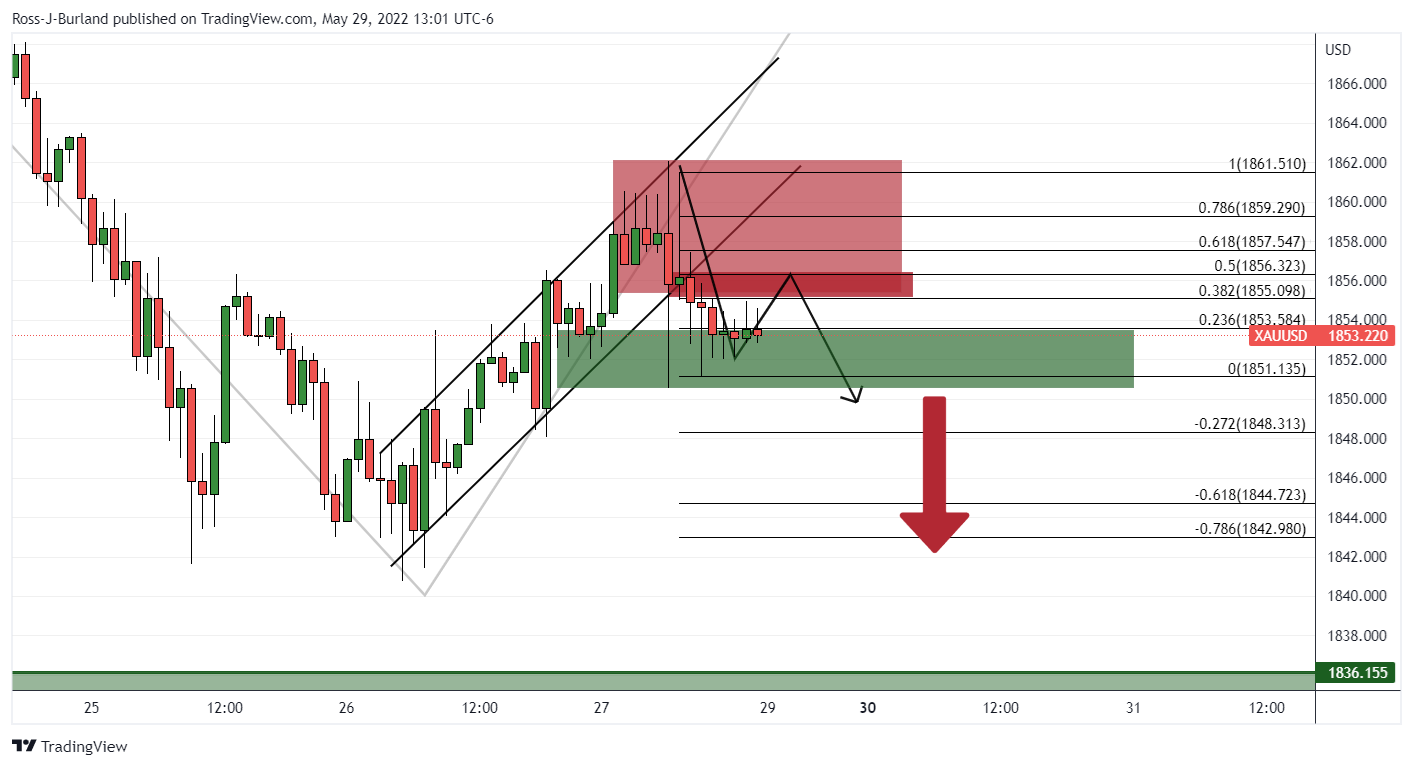
When zooming down to the hourly chart, the price is seen testing the $1,850 level but should bulls fail to break near term resistance, the bears could be encouraged to firm up and drive the price into the $1,850 for a further test. If this were to break, then the downside will be to play for and bears can eye the daily chart's W-formation's neckline top at $1,836.155 as a target again.
Author

Ross J Burland
FXStreet
Ross J Burland, born in England, UK, is a sportsman at heart. He played Rugby and Judo for his county, Kent and the South East of England Rugby team.


