Gold, Chart of the Week: Technicals aligned with fundamentals, $1,850 eyed
- Gold bulls looking for a softer US dollar in the open and eyes a test of $1,793 in the coming sessions.
- $1,780 support could lead to a significant run higher for the becoming days.
- Coronavirus Omicron variant and hawkish Fed leading to safe-haven appetite.

The gold price is holding up considering the shift towards inflation at the Federal Reserve, despite the new coronavirus Omicron variant and less emphasis on the jobs market. This is making for higher market volatility due to the risk of higher inflation along with the risks of Omicron and supply bottlenecks (leading to a higher risk of ''persistent inflation'').
Meanwhile, the Nonfarm Payrolls was still strong despite the miss from the prior and expectations. Data, in general, remains strong and a fast taper is still expected with the foot left on the gas at the Fed. This lead to a rise in the US dollar following positive revisions and solid details such as a lower Unemployment Rate at 4.2% vs 4.5% expected and 4.6% prior. The US currency initially fell after the jobs report came out, but ultimately gained as investors pored over the details of the report.
The US dollar, as measured by the DXY index vs. a basket of currencies ended 0.02% higher within the day's range of between 95.967 and 96.448 the high. For the open today, the price, while technically still in bullish territory, there is the case for an imminently weaker greenback that could play into the hands of the gold bugs from the get-go:
DXY H1 chart
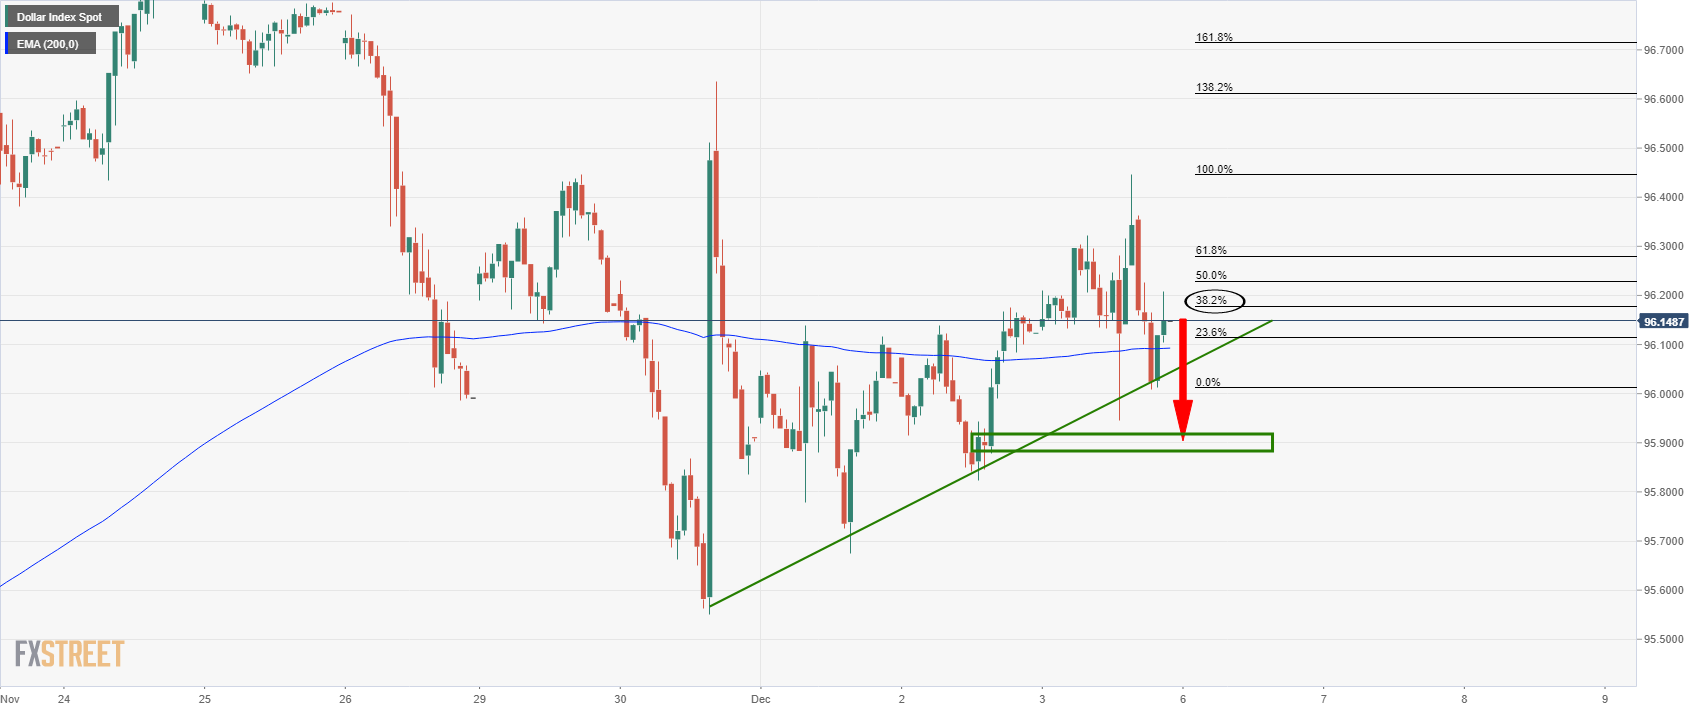
As illustrated, the price is trading above the 200-EMA, but that could all change considering the bearish tendencies of the last couple of sessions' price action. The price recovered a 38.2% Fibonacci retracement of the prior hourly bearish impulse from trendline support.
If the bears engage in the opening sessions on Monday, then the price will be pressured yet again to test the dynamic trendline support. This would be expected to give way to a breakout into at least the 95.80s. Pressures could mount again if bulls daily to get the price back above what would be a new counter-trendline line resistance between 96 the figure and 96.20.
Such a scenario would play into the hands of the gold bulls that are already encouraged by higher prospects of investors seeking out safer havens. This is a good segue into the technical outlook for XAU/USD.
Gold technical analysis
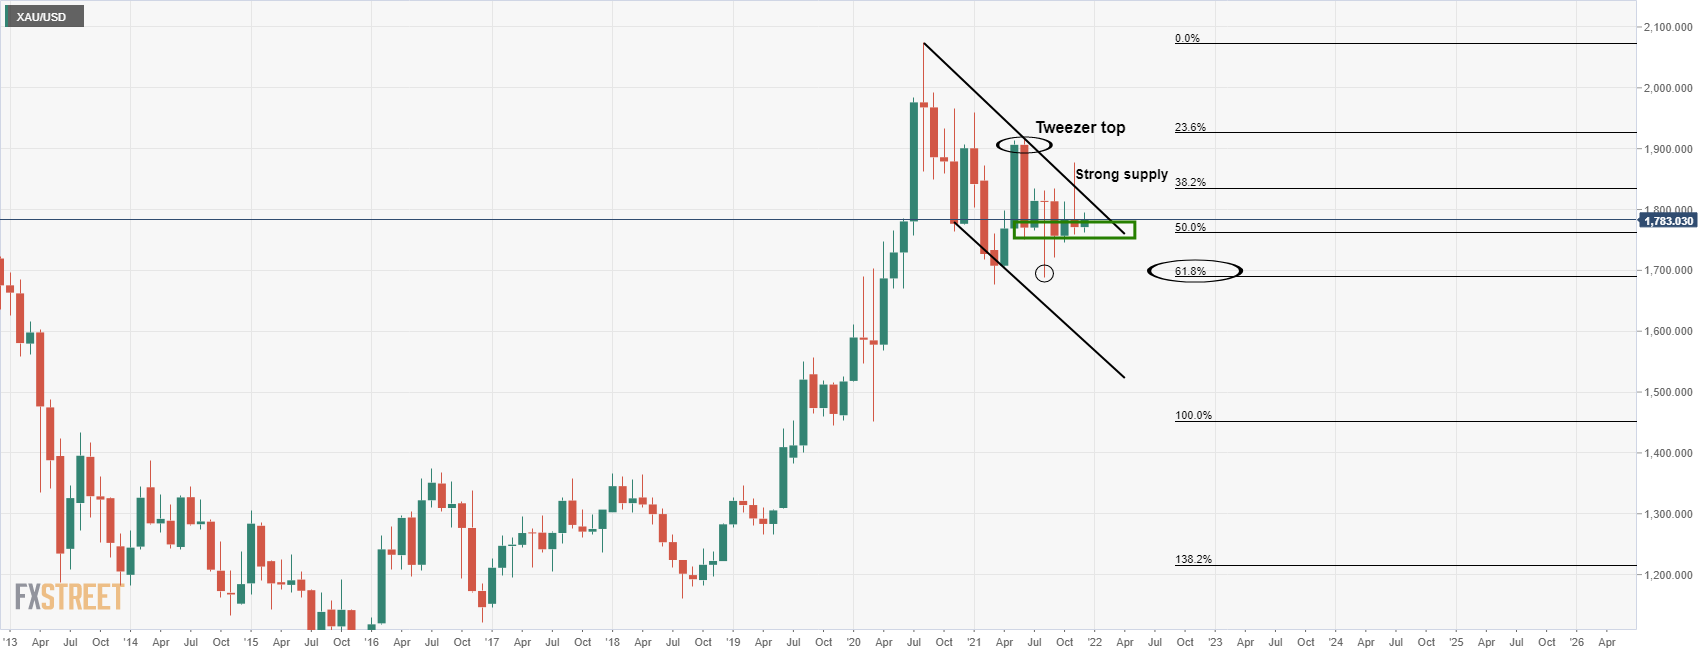
Starting with the monthly chart, the bulls are holding the fort following a 61.8% Fibonacci retracement. This is despite the bearish tweezer top that failed to result in more than a 61.8% Fibo retracement.
The 2021 lows are clearly in an area of strong demand between $1,677, $1,720. The 50% area of the monthly range between Aug 2020 and March 2021 is where the bulls are committing currently, near $1,760.
From a daily perspective, a push above $1,793 opens risk to $1,850 for the month of December according to the daily chart:
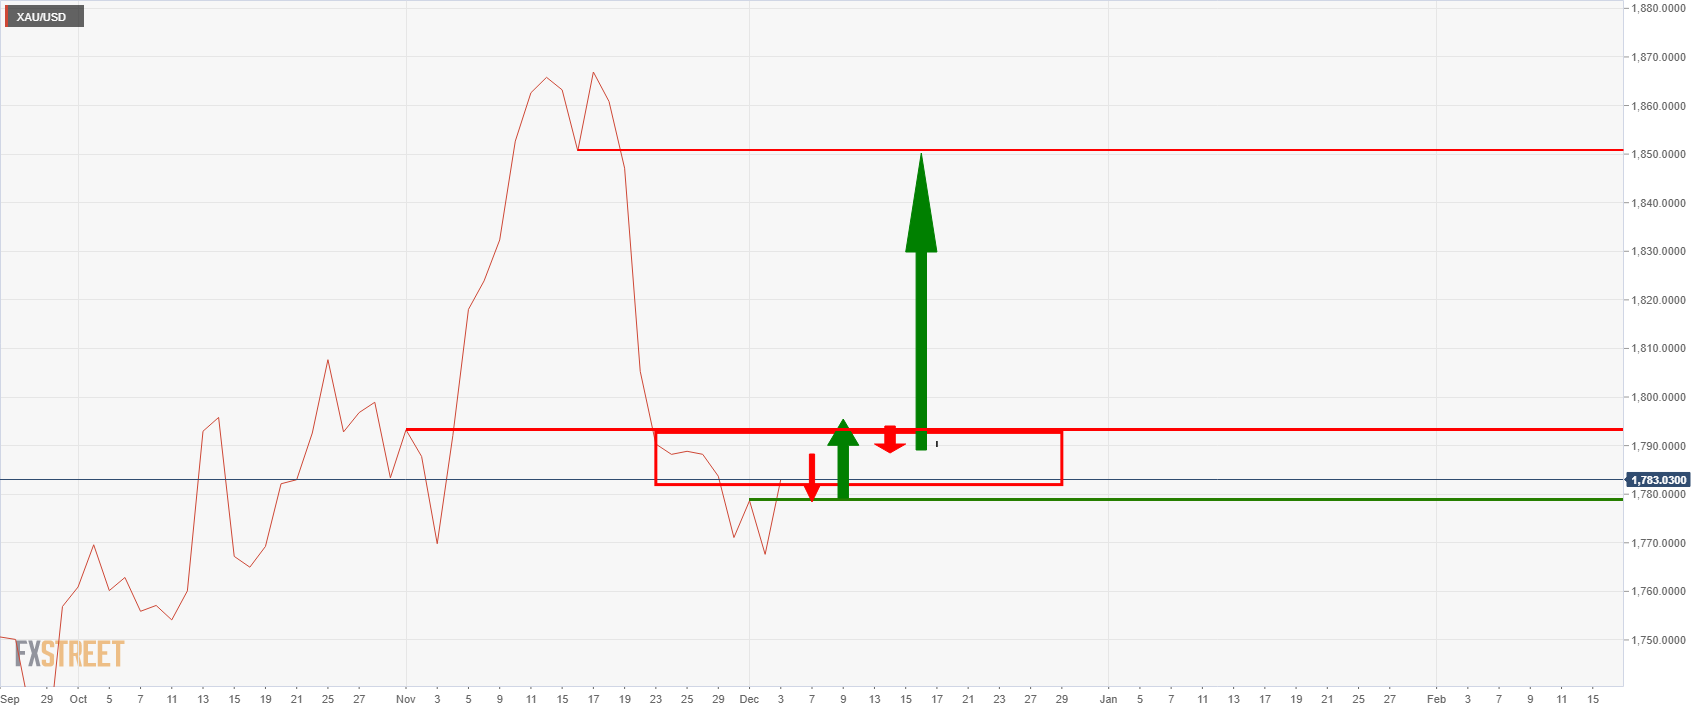
The above line chart identifies the $1,780 as being a potential key level of support for the open with risks of a test of $1,793 to open the runway towards the M-formation's neckline of $1,850.
The case for lower gold price
With all the being said, it takes two views and positions to make a market. Analysts at TD Securities argue that, ''increasingly, the balance of risks in the immediate term is tilting in favour of lower prices, as gold has struggled to shore up enough support to catalyze a buying program in recent days, despite the threshold for CTA short-covering having been razor-thin.''
The analysts added that ''the threshold for covering is rising in response to the weak price action, decreasing the probability of a positioning squeeze as the yellow metal must now rally north of $1800/oz in order to catalyze the buying program.''
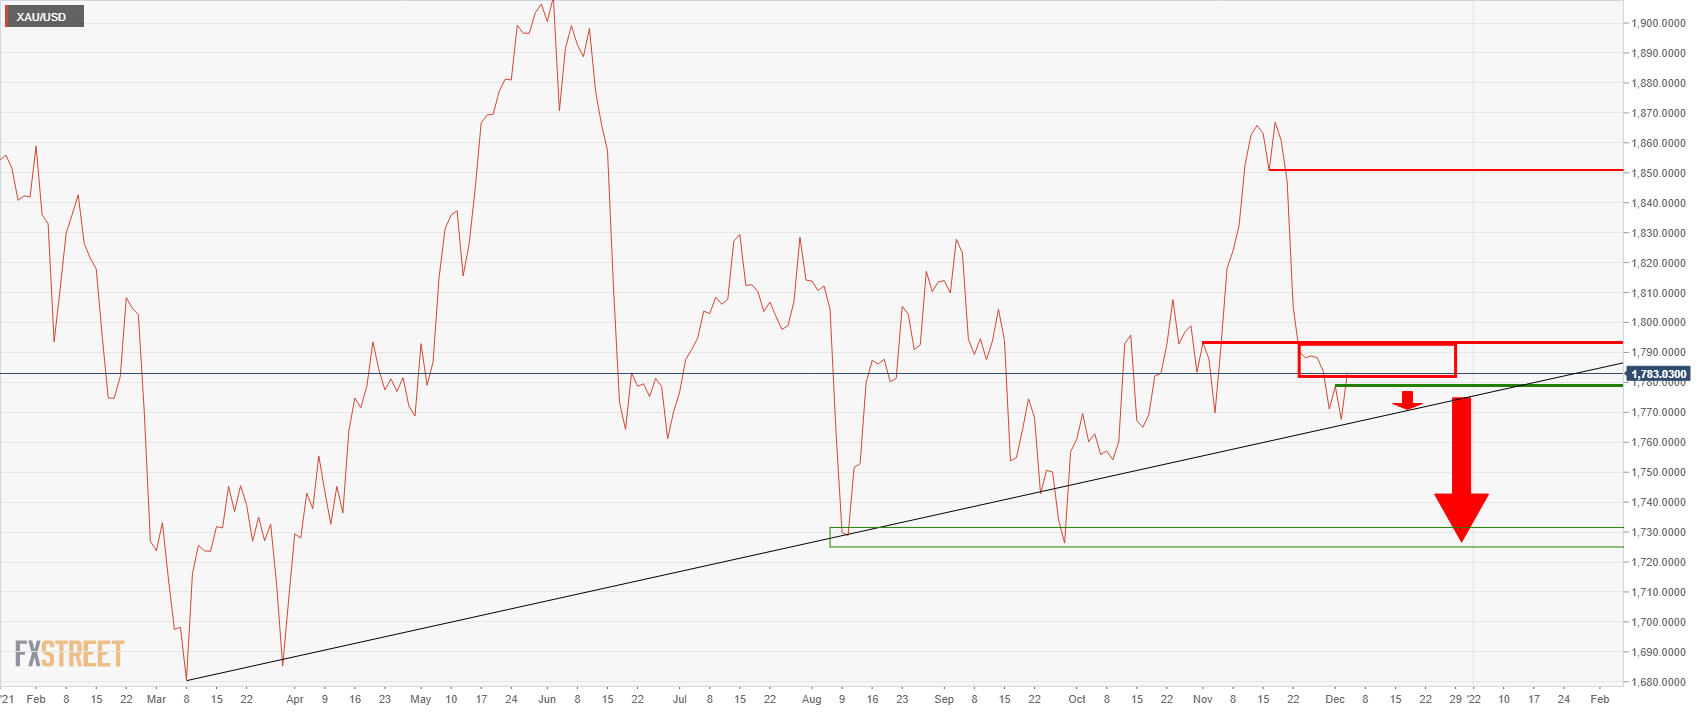
A break of the daily dynamic support, as illustrated above, opens risk to the $1,720s.
Premium
You have reached your limit of 3 free articles for this month.
Start your subscription and get access to all our original articles.
Author

Ross J Burland
FXStreet
Ross J Burland, born in England, UK, is a sportsman at heart. He played Rugby and Judo for his county, Kent and the South East of England Rugby team.


