Gold broke the continuation pattern yesterday

GOLD
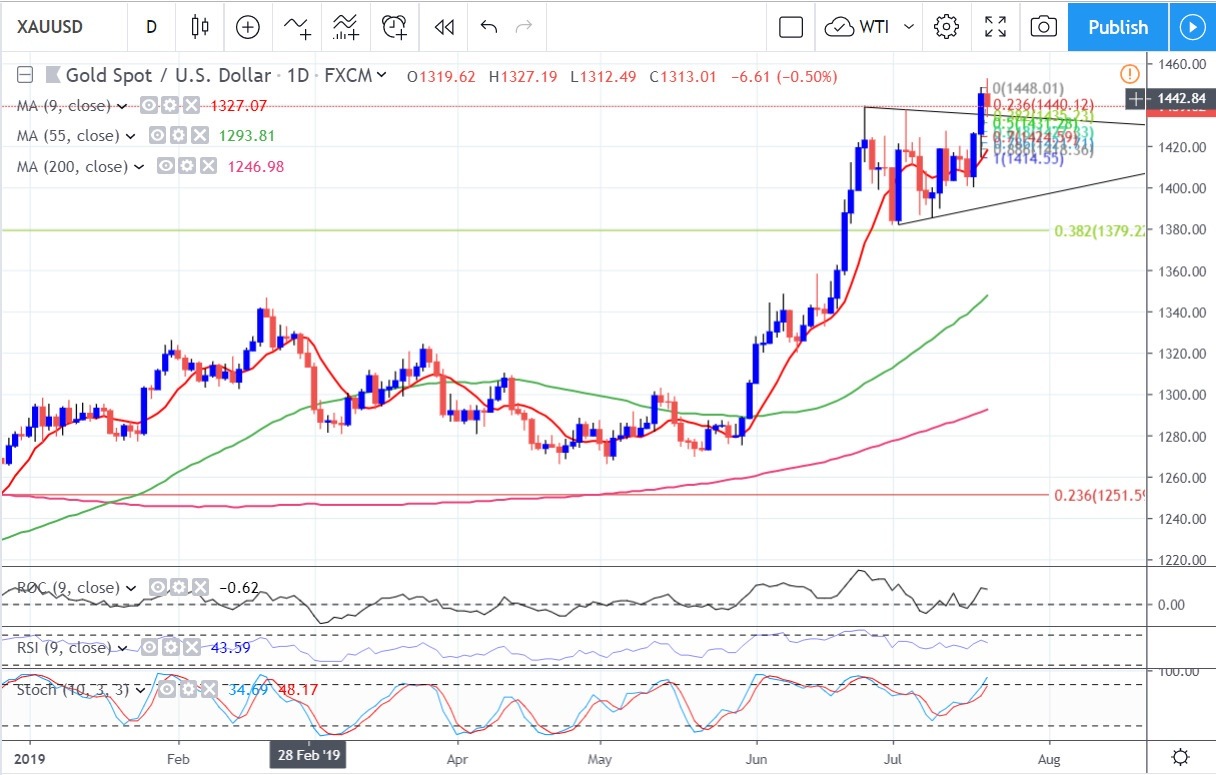
Gold broke the continuation pattern yesterday and traded to 1448...We have seen a return to the breakpoint of 1434 and up we are again...Ignore overbought levels...as this is starting to trend these indicators will prove fruitless....go on price action only on here and measured targets...Now there are measured targets from this pattern...the initial on is the highest point of the pattern...1439...to the lowest 1381...you subtract 1381 from 1439 leaving you with a 58$ differential...
Now...add 58$ onto the break of the pattern...In this case 1439...and what do we get...1497...Now this is the minimum measured target....what in reality we are taught is that the length of the pole can be a measured target also..so we do the sums again...this time taking it further apart...thus...1439 minus 1275 = a 164$ move...add 164 onto 1439 and you get a long term target of 1603....
With these continuation patterns they are very easily seen...and usually take less than 4 weeks to form on a daily charts...Obviously the weekly and monthly timeframes have different time predictions....We are long Gold at 1434 and 1442...and we will hold this position...because unless Gold crashes below 1410 we are still on course for the measured targets stated above..Of course we will have pullbacks...we expect that..but the Fib levels and Pivot Points and chart support I have put on the charts will help us negotiate the " noise" and hopefully keep us in this trend for min target 1497...
Author

Carol Harmer
Charmer Trading
Carol Harmer has over 39 years experience of analysing and trading the world's markets and is undoubtedly one of the most respected technical trader in the world today.