Gold breaks to 2019 highs, with dollar traders focused on consumer data

Market Overview
With traders already seeing a glass half empty, the news of geopolitical tensions rising in the Middle East has bolstered support for safe haven assets. A couple of oil tankers being attacked around the Strait of Hormuz (a crucial waterway for oil out of the Persian Gulf) is pulling oil prices higher, but also spiking tensions between the US and Iran once more. With bond yields falling again, the yen and Swiss franc are beneficiaries amongst forex majors, whilst gold has broken out to new 2019 highs. However, attention turns back towards economic data today. With what is building up to be a crucial meeting of the FOMC next week, there are some key US consumer data points which could be key indicators of how the Fed reacts. Around 70% of the US economy is driven by the consumer and retail sales are a key indicator here. However, consideration of confidence is also necessary. The Michigan Sentiment gauge has held up well throughout 2019 despite the market wobbles. It is expected to slip back (driven by a dip in both current conditions and expectations) but if consensus is hit, the indicator will not be showing any real undue signs of stress on the consumer (yet). However, if we see the consumer indicators following the perception of a deterioration in the industrial environment, then there will be something for the rate cut advocates to crow about. Safe havens would benefit further, with a dollar underperformance.

Wall Street closed higher with the S&P 500 +0.4% at 2892, with US futures a tick or two higher early today. In Asian markets a mixed session, with the Nikkei +0.3% whilst the Shanghai Composite was -0.6%. In forex, there is a continued risk aversion, with the yen being the main outperformer, whilst the commodity currencies (seen as higher risk) of AUD and NZD are under increasing pressure. In commodities, the bull run on gold has renewed with gusto as the price pulls into the $1350s and at its highest since April 2018. Oil closed 2.2% higher yesterday on the news of the oil tanker attacks and is edging slight gains once more today.
The is a significant US theme to the economic calendar and some key consumer indicators too. US Retail Sales is at 1330BST and is expected to show sales ex-autos increased by +0.3% in May (up from monthly growth of just +0.1% in April). US Industrial Production at 1415BST is expected to show +0.2% growth in the month of May (an improvement from the -0.5% decline in April), with Capacity Utilization improving to 78.0% (from 77.9% in April). The other key data is the Michigan Sentiment at 1500BST which is expected to drop back to 98.0 (down from a downwardly revised 100.0 in May).
Chart of the Day – AUD/JPY
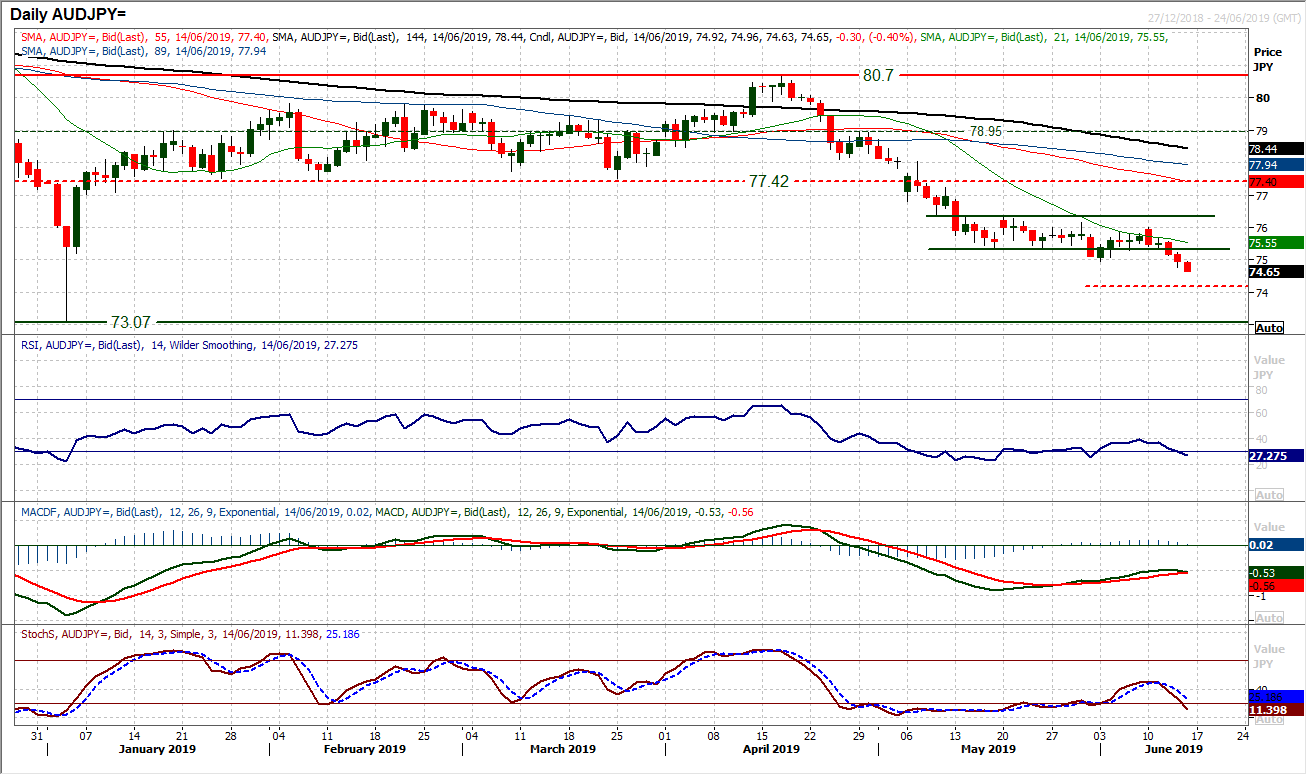
Risk appetite under pressure tends to mean safe havens benefit and higher risk currencies underperform. This is a key basis of the weakness on Aussie/Yen now. We looked at the negative technical implications of a breakdown of a near term range a couple of weeks ago (implying 74.25). A subsequent technical rebound has now been sold into. A bearish engulfing candlestick has left key resistance at 76.00 and a run of negative candles now creates renewed sell signals on momentum indicators. The RSI failing at 40 and back under 30, along with a bear cross on Stochastics show the bears back in control. The old support around 75.30 is now a basis of resistance to restrict rallies. The hourly chart shows negative configuration on momentum with the hourly RSI failing between 50/60 and hourly MACD lines increasingly stuck under neutral. Intraday rallies are a chance to sell. Further selling pressure is coming this morning and the downside target of 74.25 is open. There is little support until the January spike low at 73.07.
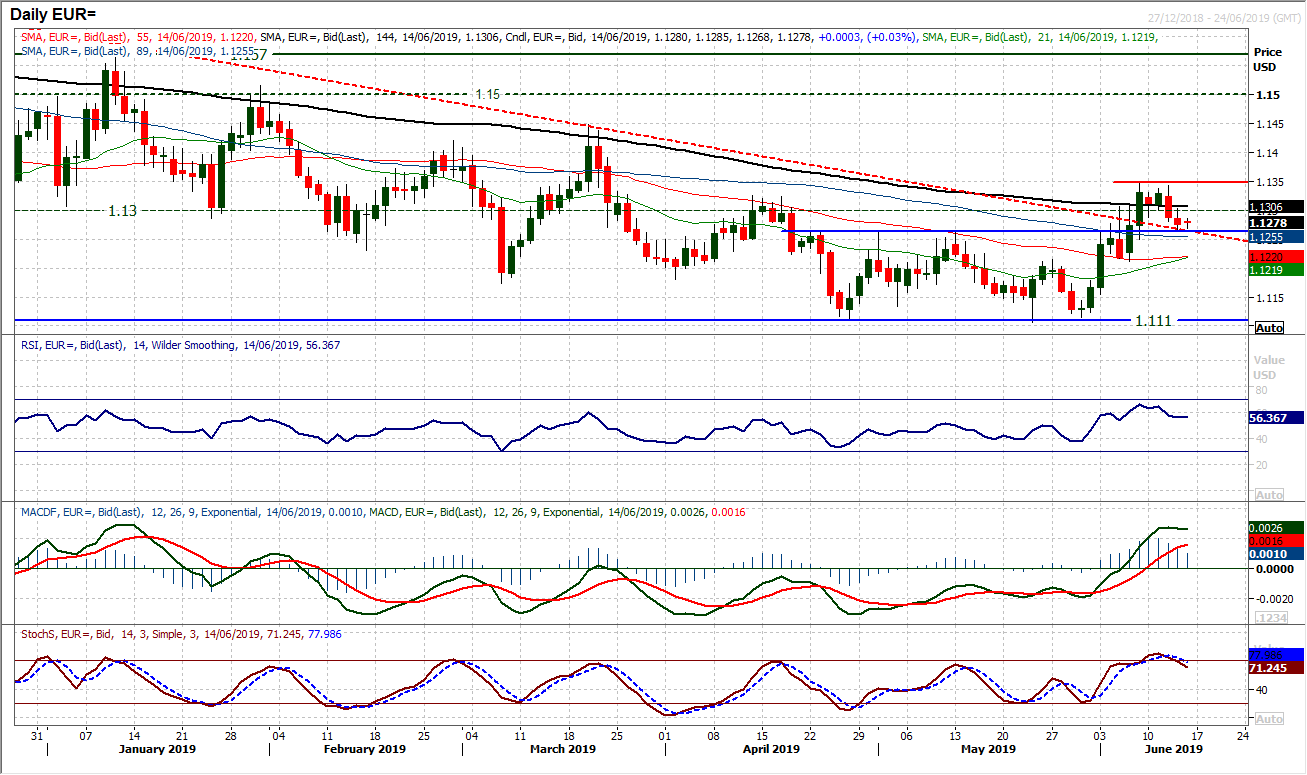
All week we have been looking at the importance of the breakout above $1.1265 and the old floor at $1.1300. Wednesday’s bearish engulfing candle has switched the emphasis of the outlook. Another negative close and bear candle, a day after a bearish engulfing is never encouraging for the bulls. Losing $1.1300 as a basis of support and it has now become a basis of resistance. A close back below $1.1265 would now be a real concern for the bulls. It would also bring the market back under the old long term downtrend which should now be acting as a basis of support. Losing $1.1265 opens $1.1212 which is a key higher low within the recovery. With the Stochastics now finding traction lower following a bear cross, the RSI back under 50 would confirm a correction setting in again. The hourly chart shows resistance with a near term pivot at $1.1300 under what is growing into a key high at $1.1347.
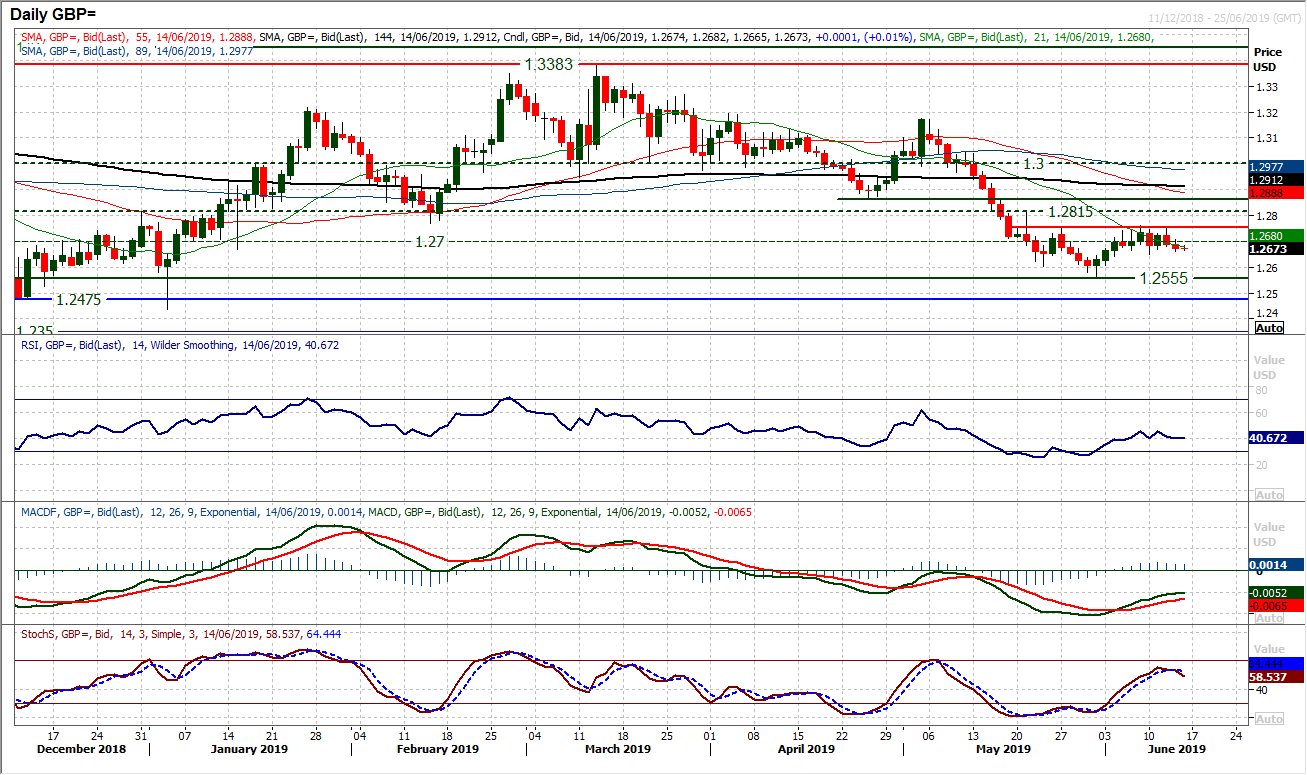
Cable remains stuck in its 110 pip trading band that is now into its eighth session. The resistance at $1.2755/60 is mounting, but equally, the support at $1.2650 is also still intact. However, notably, in the wake of a second negative candlestick yesterday, the Stochastics have bear crossed lower. With MACD lines struggling for upside traction and RSI stuck in the low 40s, this is not a chart that looks to be ready to break higher. The hourly chart shows intraday rallies now fading and a negative bias within the range. However, equally though, there is not a massive selling pressure either. The hourly RSI continues to oscillate between 30/70 and whilst 30 remains intact the downside pressure is limited at this stage. That said, a move below $1.2650 is the more likely break when one comes, and would open $1.2555.
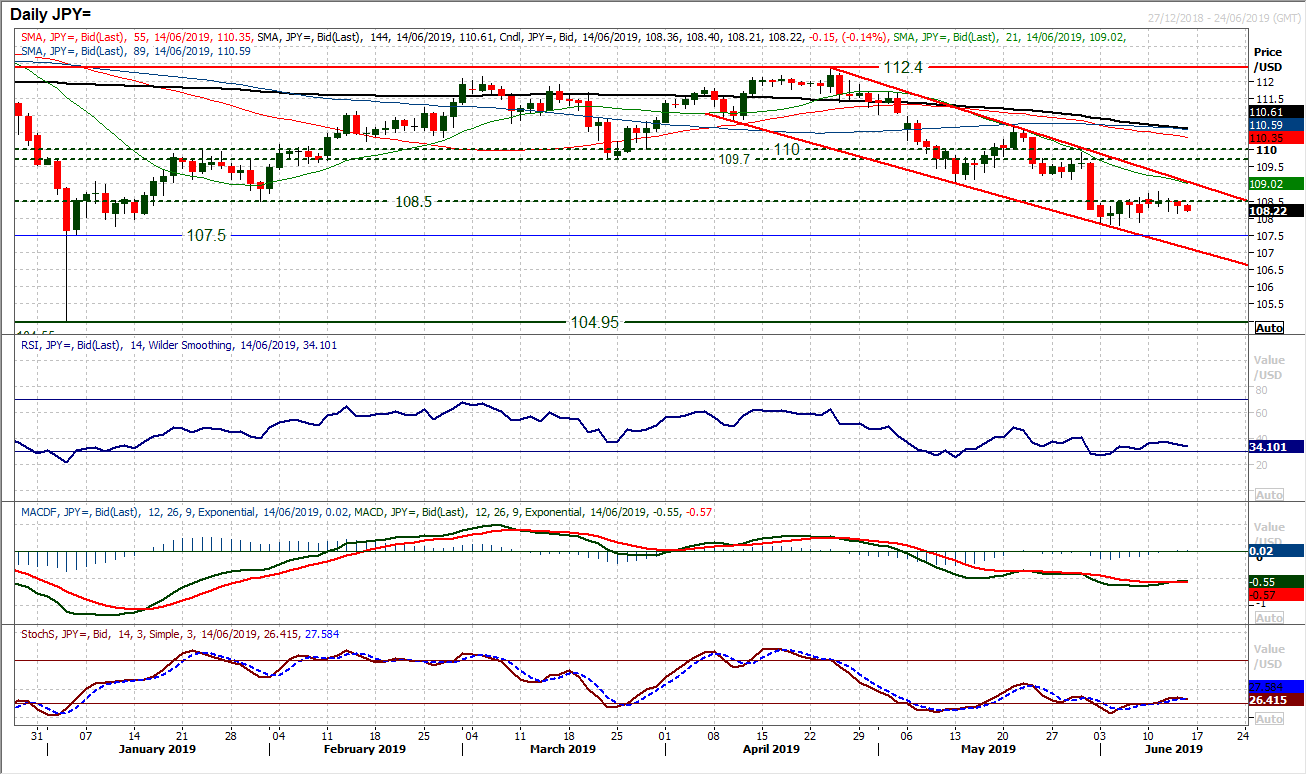
Even though the dollar is beginning to claw back some losses, the broad risk averse sentiment across markets is still a drag on Dollar/Yen. The resistance around the old 108.50 late January low has been restrictive all week and the emphasis has begun to shift lower. Where previously the market had been edging higher daily highs, having hit 108.80 as resistance this has now turned to consecutive lower daily highs. Momentum indicators are not set up for any decisive recovery. The RSI has again rolled over at a lower level, this time under 40, whilst MACD and Stochastics are stagnant in their attempted moves higher. With the downtrend falling around 109.10 and the 21 day moving average (a great basis of resistance ) around 109.00 today, the overhead negative indicators are moving in. A move below yesterday’s low at 10.15 would re-open the support around 107.80. It is also worth noting that a close under 108.00 (not seen since early January) would also be a big negative signal too. The hourly chart shows initial resistance around 108.55.
Gold
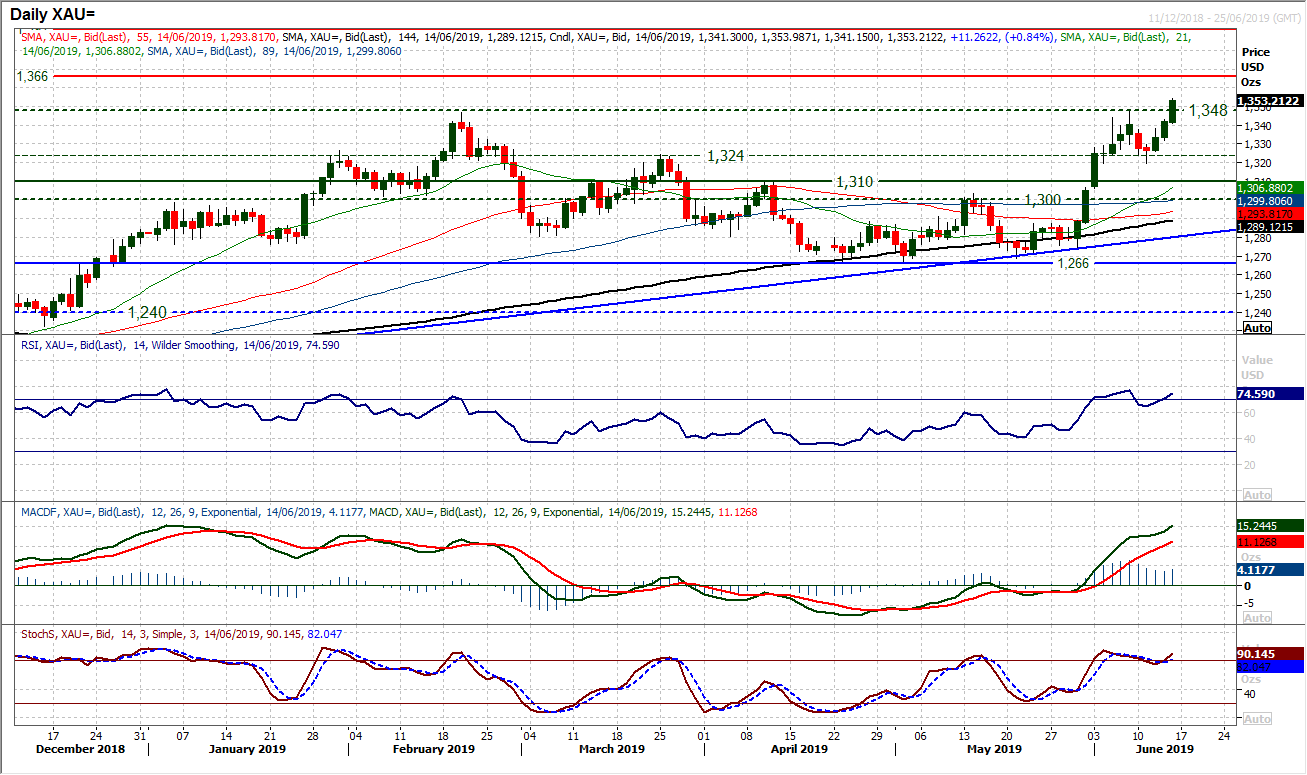
Breakout on gold! The elevated geopolitical tensions in the Persian have translated through to a boost on gold. This morning, with gold testing higher overnight, the European traders have come in and smashed thrrouh the ceiling of resistance at $1348 to pull gold to its highest level since April 2018. A continuation of the negative sentiment through global markets and geopolitical risk will underpin renewed support for gold. Technically this is a very strong move, with RSI back higher into the 70s is a strong response from the bulls, whilst Stochastics are ticking higher again and the MACD lines are renewing their extension higher. This is a gold run that is being backed, but also comes with an element of caution too. The move to new 2019 highs opens the 2018 high at $1366 as the next resistance. However, this is now a huge band of crucial long term resistance and needs to be treated with caution. How much upside potential can there still be? For several years, every rally on gold has failed in the resistance band $1347/$1375. For now though, the outlook remains positive and the bulls are supportive. On the hourly chart, a strong configuration on momentum is helping the bulls higher. The breakout at $1348 is initially supportive, with an intraday band $1330/$1338. Going with the run for now, however, caution is needed if the rally begins to run out of steam.
WTI Oil
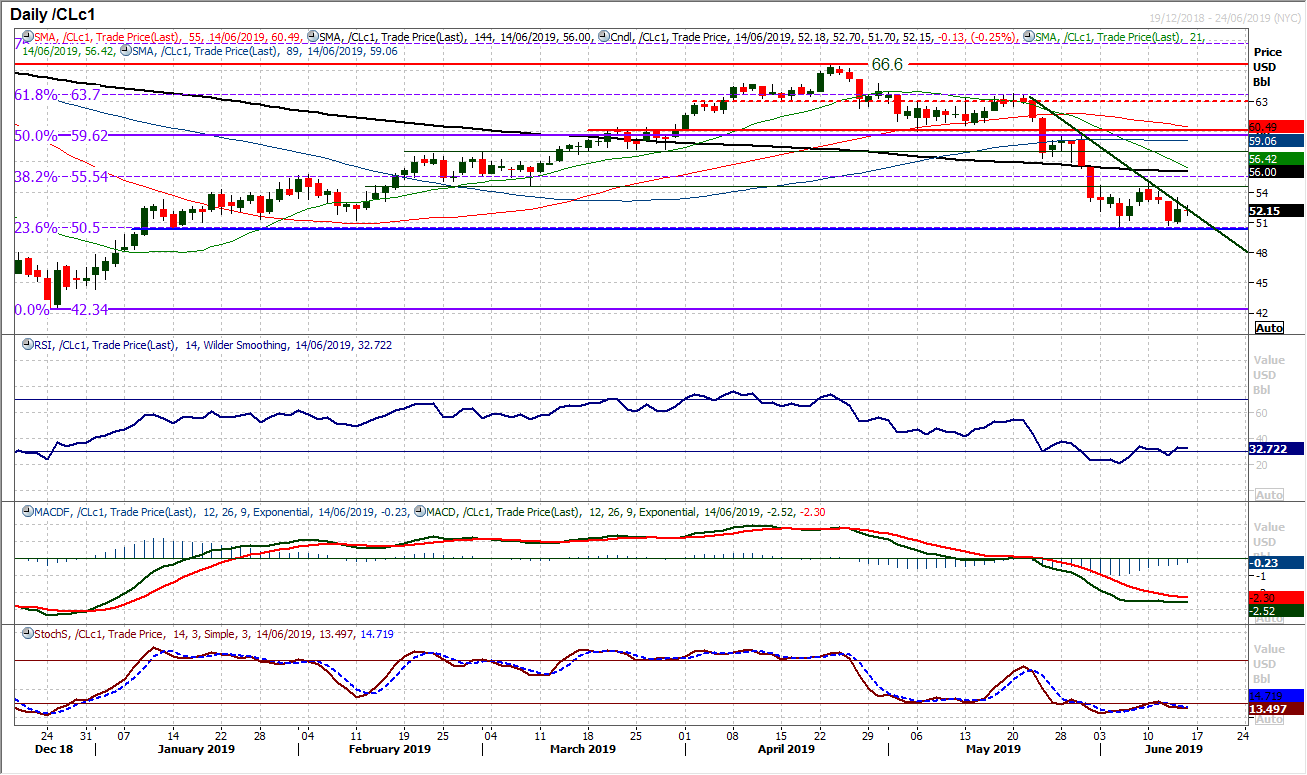
When geopolitical newsflow hits the oil market there can be huge swings in sentiment. This has been seen with the rally of over just over 2%yesterday. However, interestingly, it could have been much more as the market was well over 4% at one stage, giving up gains into the close. How the bulls react in the coming days (as the dust settles) will be key. The market is ticking back higher again today and the move is now breaking the three week downtrend resistance. It would seem that the floor above $50 is intact, at least for now. However, from a technical perspective, more needs to be done to trust a rally would be sustainable. Yesterday’s high at $53.45 is certainly an initial benchmark, whilst the key resistance is the lower high at $54.85. For now, momentum indicators look uncertain of the rally. RSI has ticked higher but remains drab in the low 30s, whilst MACD and Stochastics remain stuck and negatively configured. Initial support at $51.70 will be watched.
Dow Jones Industrial Average
There is a sense of uncertainty that has crept into the Dow in recent sessions. With a one week uptrend broken, the momentum of the early June recovery has been lost, to be replaced by consolidation. The bulls will be looking at the basis of support forming at the breakout of 25,958 as reason to still be confident. However, this comes with the RSI bumping up against 60, Stochastics flattening and MACD lines just beginning to fade around neutral. These are all areas where the medium term bears (who have been in control until just over a week ago) will be eyeing an opportunity. The resistance at 26,249 needs to be breached otherwise the bulls will begin to become tetchy and profit-taking could set in again. The hourly chart still has broadly positive momentum configuration, however, back below neutral on MACD lines would be a warning. A close below 25,958 would suggest the unwind lower is setting in again.

Author

Richard Perry
Independent Analyst
Richard Perry, Independent Market Analyst, has over 20 years of experience working in financial markets in London.


