Gold braces for US CPI near $4,100: 3 analysts, 3 different maps of what happens next

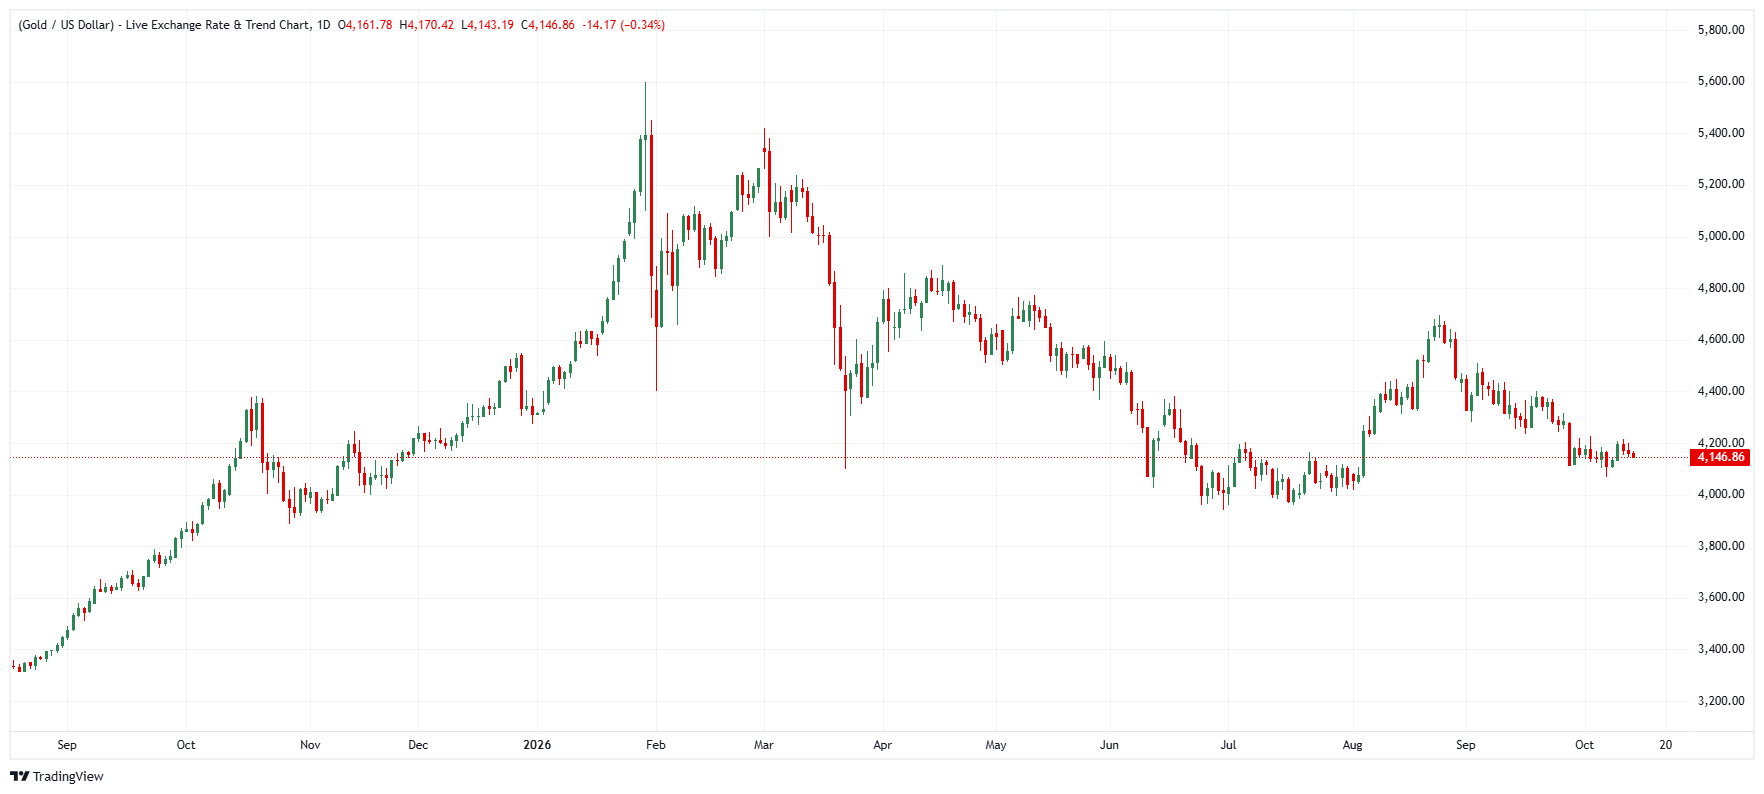
Gold (XAU/USD) heads into today's US Consumer Price Index (CPI) report pinned near $4,160 after a third straight day of losses, with $4,100 in the crosshairs. Three fresh analyses agree on one thing — the inflation print decides the metal's next major move. Where they split is what happens after: one analyst sees the downside breaking open, another says the market is trapped in a patient corrective triangle, and a third expects a pullback that flips into a rebound.
FXStreet's Dhwani Mehta: $4,100 at risk as the SMA ceiling thickens
Dhwani Mehta reads the correction as structurally bearish. "Gold is extending the recent downtrend into a third consecutive day on Wednesday, looking to challenge $4,100 ahead of the critical US Consumer Price Index (CPI) data release," she wrote. The yellow metal trades below all major moving averages — capped beneath the 21-day SMA at $4,216, with the 100-day SMA at $4,250 and the 50-day SMA at $4,337 reinforcing a dense overhead supply zone, and the daily RSI (14) at 42.93 flagging subdued bullish momentum rather than oversold conditions. Her event logic is two-way but asymmetric: a hotter-than-expected CPI reading "could strengthen expectations for another Fed rate hike this year," boosting yields and the US Dollar and increasing selling pressure on Gold; cooler inflation could revive the recovery. The structural floor she watches is the rising trendline support around $4,001.95. — Read the full report
Wavetraders' Gregor Horvat: The overlap below $4,200 means "the bears are still alive" — but don't chase
Gregor Horvat brings the Elliott Wave lens, and his key evidence is the overlap beneath $4,200. "A five-wave rally points to a new impulse and trend continuation, while a three-wave rally is typically corrective, which means the bears are still alive," he noted. His working count is a running triangle inside the $4,050-$4,700 range, with the 61.8% Fibonacci level for wave D sitting around $4,100 — precisely where Mehta's risk zone begins — and a potential wave E recovery capped at the $4,400-$4,600 resistance on the higher-timeframe picture. The deeper structure supports even lower levels eventually: the ideal strong support for the bigger wave-four correction is the $3,900-$3,200 zone. His posture is deliberately patient — triangles "take time; they frustrate both bulls and bears." — Read the full report
Independent analyst Mohamad Gharib: The arc says hold $4,119, rebound to $4,167
Mohamad Gharib is the one voice with an explicit bounce scenario. Applying Arc Cycle Analysis to the 2-hour chart, he sees the 0.5 Resistance Arc at $4,167 continuing to cap upside after bullish momentum stalled beneath it, with a near-term pullback favored toward $4,119, close to the 0.382 Support Arc. "If price holds at 4,119, a rebound toward the 0.5 Arc at 4,167 becomes the preferred scenario. Conversely, a sustained 2h close below 4,077 would invalidate this scenario and open the path toward the next Support Arc at 0.236." — Read the full report
The takeaway
Three analysts, three different maps, one shared pivot: today's US CPI. Mehta makes $4,100 — and below it the $4,002 trendline — the line in the sand for a bearish break; Horvat counts the same $4,100 zone as wave-D support inside a range that could eventually pay patient traders up to $4,400-$4,600; Gharib needs $4,119 to hold for the rebound to $4,167 to play out. With US core CPI expected to rise 0.2% monthly and 2.5% annually (from 2.4% previously), a hot print favors Mehta's downside map; a cool one opens the first door to Gharib's rebound and Horvat's wave E.
(This article was created with the help of an Artificial Intelligence tool and reviewed by an editor. Know more.)
Author

FXStreet Insights Team
FXStreet
The FXStreet Insights Team is a group of journalists that handpicks selected market observations published by renowned experts. The content includes notes by commercial as well as additional insights by internal and external analysts.