Gold slips below 4,200 – Was the rally from June only three waves?

US CPI is out today, Wednesday, October 14, and markets may be a bit quiet into the numbers. Gold, however, has already given us something important to think about.
The metal has come down and made a very important overlap below 4,200, and from an Elliott Wave point of view, I think this tells us a lot. When I look at the recovery from the June lows, this overlap suggests that the move may have been only a sharp three-wave rally with an extended wave C, not a five-wave impulse. And that's an important difference for me. A five-wave rally points to a new impulse and trend continuation, while a three-wave rally is typically corrective, which means the bears are still alive.
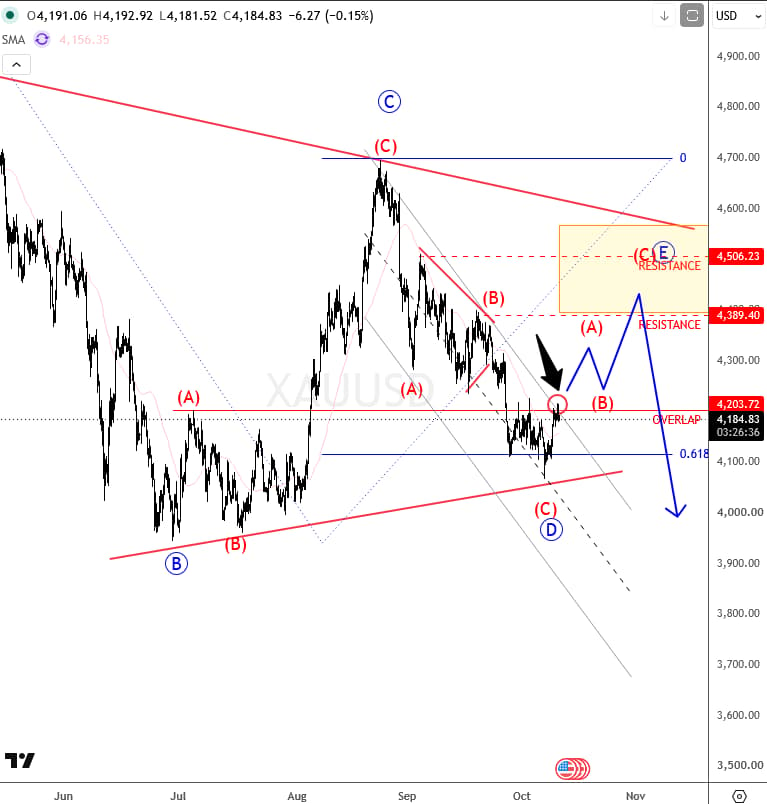
That said, I still see the price action as somewhat neutral, with gold trapped between the 4,050 and 4,700 areas. When I see a market overlapping like this in a wide band, I personally start to think about triangles, and here I'm considering a possible running triangle.
If that count is correct, gold could stabilize now around 4,100, where I see the 61.8% Fibonacci level for wave D. From there, a wave E recovery could develop. But when I put this 4-hour structure together with the higher time frame picture, it looks to me like the bigger wave four correction from the all-time highs is still ongoing, so any rally out of the current 4-hour downtrend channel could be limited around the 4,400-4,600 resistance.
On the bigger picture, gold has been trading in an impulsive fashion, but it's now in a wave four correction that could slowly come to an end later this year. The ideal strong support for that correction is the 3,900-3,200 zone.
What does this mean in practice? I would not chase gold lower here, but I'm also not in a rush to buy aggressively. Triangles are patient patterns; they take time, they frustrate both bulls and bears, and the best opportunities usually come when the pattern is close to completion.
The levels I'm watching:
- 4,200 – the overlap that turned the picture more corrective
- Around 4,100 – the 61.8% Fibonacci area for possible wave D support
- 4,400-4,600 – resistance for a wave E recovery
- 4,050-4,700 – the broader range gold is still trading in
- 3,900-3,200 – ideal strong support for the bigger wave four
With CPI on the calendar, a sharp move in either direction wouldn't surprise me, but as long as gold stays within this range, I'll keep treating it as a sideways, corrective structure rather than a new trend.
Get Full Access To Our Premium Elliott Wave Analysis For 14 Days. Click here.
Author

Gregor Horvat
Wavetraders
Experience Grega is based in Slovenia and has been in the Forex market since 2003.