USD/CAD back at the 2026 highs: Pullback first, then more upside?

USDCAD has been one of the cleaner charts for me lately. The pair has pushed back to its 2026 highs, and that move tells me something important.
The recovery from the August 26 low that I've been tracking for a few weeks now looks impulsive rather than corrective. Impulses are five-wave patterns, and when I count this rise, I still can't see all five waves. That suggests the move isn't complete yet.
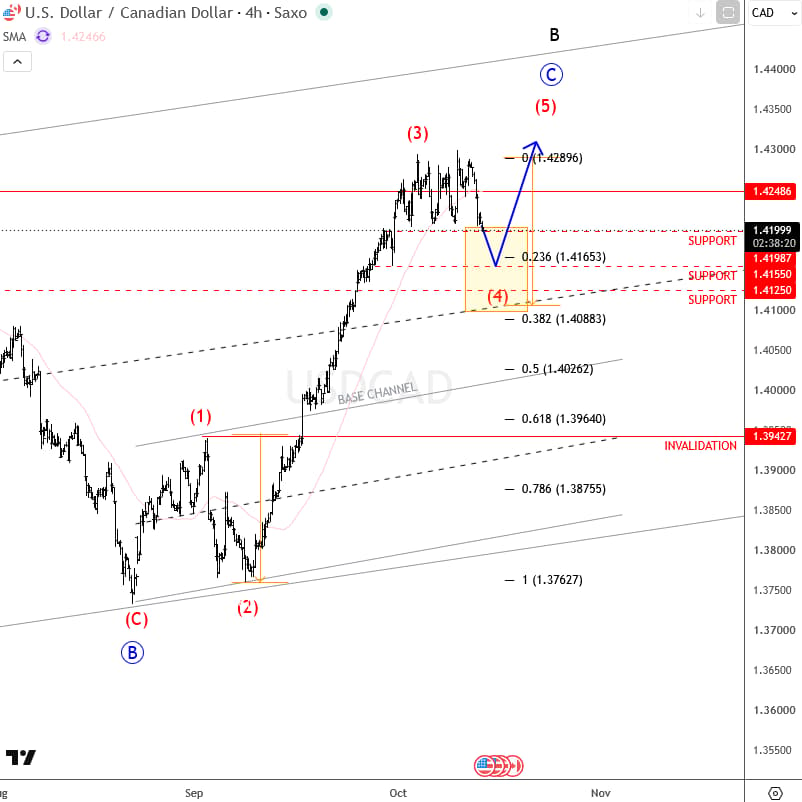
The pair is trading around 1.4211, right at the 1.4200-1.4125 support zone. If the current dip is just a retracement within the uptrend, this is where I'd expect buyers to step back in for a potential new rebound.
The key level for me is 1.4000. As long as USDCAD stays above it, I think the structure favors another leg higher once the pullback is complete. A drop below 1.4000 would make me rethink the count.
I know pullbacks can feel uncomfortable when you're expecting higher prices, but they are a normal part of a developing impulse. Markets rarely move in a straight line, and these pauses often give the trend the energy it needs for the next push.
Also keep in mind that US CPI is out today, October 14, at 14:30 CEST. The release could easily push the pair through the support zone or bounce it straight off it, so I'd expect volatility either way.
What I like about this setup is that it gives me clear reference points. The support zone tells me where a pullback could end, and the 1.4000 level tells me when I would be wrong. For me, that kind of clarity is often more valuable than trying to predict every small swing.
Key levels:
- Current price: ~1.4211.
- Pullback support zone: 1.4200-1.4125.
- Key bullish level: 1.4000.
Get Full Access To Our Premium Elliott Wave Analysis For 14 Days. Click here.
Author

Gregor Horvat
Wavetraders
Experience Grega is based in Slovenia and has been in the Forex market since 2003.