Gold, Bitcoin – Our projections for 2022

The year looks poised to end similarly to how it had begun, with lots of adverse volatility and surging uncertainty. The latest coronavirus variant has spurred a fresh selloff of higher-risk assets as investors weigh in on the potential impact that a new pandemic wave could have on the still tentative global recovery.
And while all of this seems to entail a very probable increase in market unpredictability by the end of 2021, it is once again time to look beyond the present tribulations and examine the likely direction for some of the most popular assets in 2022.
Headline inflation, the most significant determinant
For higher-yield assets and lower-risk securities alike, the future course of U.S. inflation would be the most significant determinant for their market directions in 2022. Consumer prices topped a thirty-year high in November (6.2 percent), representing the most significant threat to recovery.
While members of the Federal Open Market Committee (FOMC) have stated on multiple occasions that they expect headline inflation to shoot above 2.0 percent in the third and fourth quarters of 2021 before it slowly converges towards the FED's long term goal, the current CPI reading seems to be exceeding their initial projections. That is why many market participants weigh in on the possibility of FED tapering earlier than initially expected.
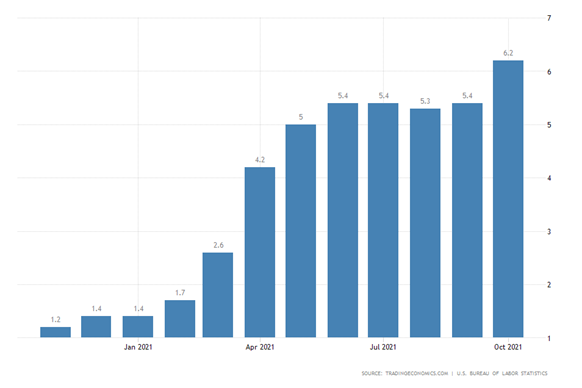
U.S. MoM Inflation Rate
The recently nominated for a second term Fed Chair Jerome Powell is due to testify before Congress this week, and his comments will shed more light on FED's next likely course of action. In light of the surging consumer prices, he is likely to adopt a slightly more hawkish-sounding rhetoric, which, in turn, would probably bolster the demand for securities.
At any rate, the Federal Reserve is expected to start to gradually lift the Federal Funds rate in 2022, entailing the end of the 'happy times' on the stock market. This would affect the price of gold and Bitcoin in two starkly different ways:
Expect the price of gold to consolidate in a range next year
Despite the uptick in demand for safe havens due to soaring inflation, this is nowhere near the levels that were observed in the wake of the pandemic. This has allowed the price of the commodity to consolidate around the psychologically significant threshold at 1800.00. As can be seen on the weekly chart below, there is a very significant likelihood that the price action continues establishing a major consolidation range around it in 2022.
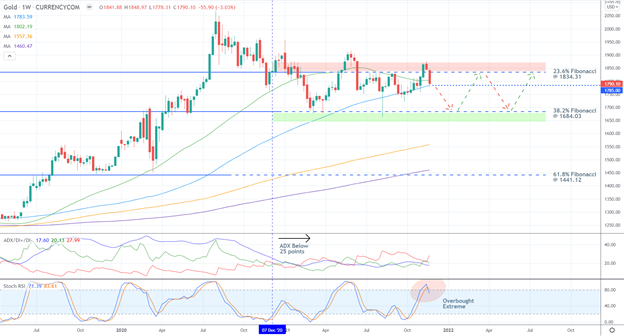
Gold 1W Price Chart
The range spans between the 23.6 percent Fibonacci retracement level at 1834.31 and the 38.2 percent Fibonacci at 1684.03. This range was first developed in early 2021, as demonstrated by the ADX indicator, which has been threading below the 25-point benchmark since December 2020.
Notice that the price action has been concentrated just above the 100-day MA (in blue) since mid-2021. Due to its role as significant floating support, the 100-day MA underpins a major threshold within the range - at 1785.00. The 50-day MA (in green) is about to converge with it, making it even more prominent support.
That is why a potential breakdown below 1785.00 in early 2022 is likely to be followed by a dropdown to the range's lower limit at 1684.03. This assertion is substantiated by the fact that the Stochastic RSI indicator has entered into its overbought extreme recently, elucidating a probable uptick in selling pressure in the near future.
For as long as the price action remains concentrated within the consolidation range, traders can continue monitoring the Stochastic RSI in order to pick tops and bottoms.
Bitcoin at a major turning point
Bitcoin's direction in 2022 will depend on the behavior of its price action around a crucially significant threshold nearby.
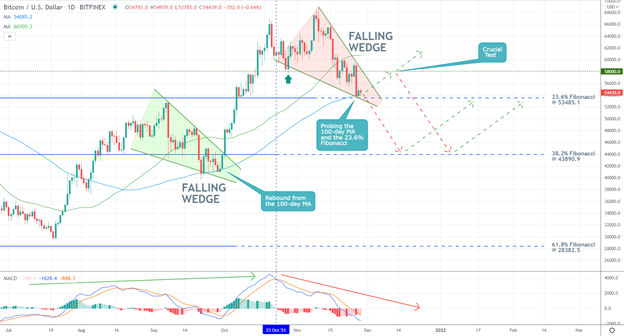
BTCUSD 1D Price Chart
The price action has been depreciating as of late, as can be seen on the daily chart above, owing to the aforementioned coronavirus scare in the market. It dropped to the 23.6 percent Fibonacci at 53485.1, which converges with the 100-day MA (in blue). This level serves as a major make-it-or-break-it threshold.
A rebound from it could signify the continuation of the underlying rally. In contrast, a decisive breakdown below it would likely be followed by a subsequent dropdown to the 38.2 percent Fibonacci at 43890.9. There are diverging indications that both bulls and bears need to pay attention to.
On the one hand, the MACD indicator has been underpinning mounting bearish momentum since the 23rd of October, which seems to support the expectations of a breakdown. On the other, the latest dropdown appears to be taking the form of a Falling Wedge. This type of pattern typically signifies a likely trend continuation, which was the case the last time such a pattern emerged around the 100-day MA.
That is why a potential breakout above the Wedge's upper limit could then be followed by a test of the previous support-turned-resistance level at 58000.00. A decisive breakout above it would confirm the continuation of the rally further up north.
Author

Plamen Stoyanov
Trendsharks
Plamen started his career on the global capital markets in 2012 when he began trading with financial derivatives.


