GBP/USD stays resilient above crucial support [Video]
![GBP/USD stays resilient above crucial support [Video]](https://editorial.fxstreet.com/images/Markets/Currencies/Majors/GBPUSD/british-banknotes-14144912_XtraLarge.jpg)
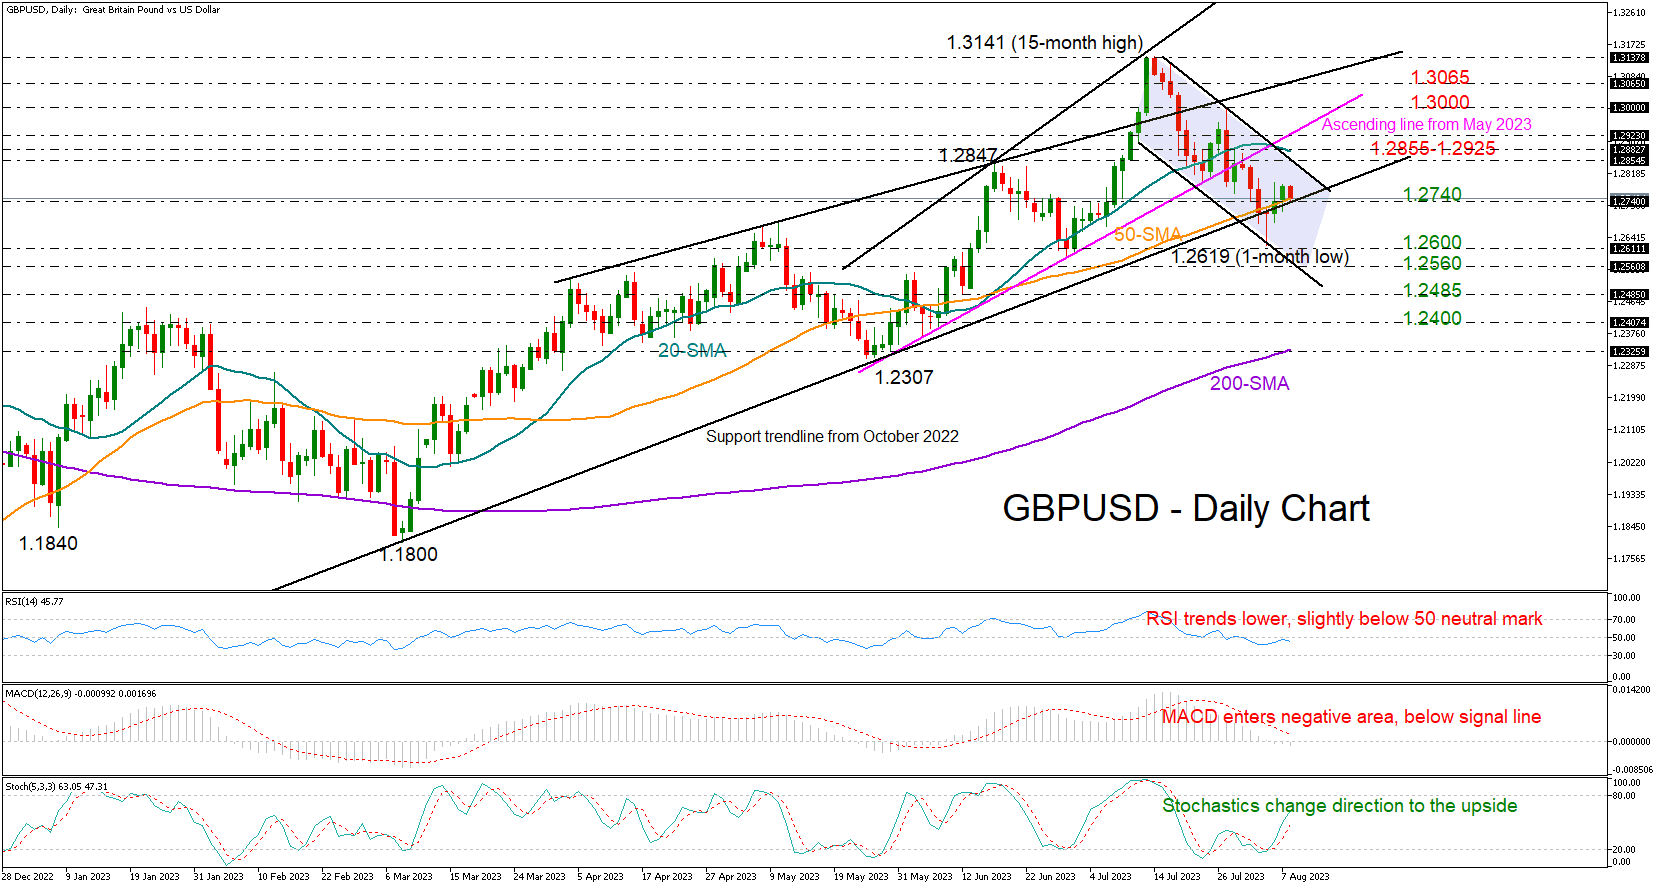
GBPUSD closed higher than its 50-day SMA and the resistance trendline from October 2022 on Monday, indicating a higher chance for more positive sessions.
Moreover, the doji candlestick printed at the bottom of the bearish channel on August 3 was followed by two green candlesticks, promoting an extension towards the channel’s upper boundary at 1.2855. The 20-day SMA and the broken ascending trendline from May are within a breathing distance too, at 1.2880 and 1.2925 respectively, while in the weekly chart, the constraining 200-period SMA is placed in the same region. Hence, traders might wait for a close above 1.2925 before they send the price towards the 1.3000 psychological mark or even higher to the resistance line from April at 1.3065.
The RSI and MACD are conflicting with the bullish scenario because they're both trending downward and in the bearish area. On the other hand, the Stochastic oscillator has bottomed out in the oversold region and is on the rise again. Interestingly, the signals are similar to those back in May, when the pair eventually staged a notable rally to 1.2847. Hence, some patience might be required in the coming sessions.
In the event selling pressure resurfaces below the key support trendline at 1.2740, the price could seek shelter somewhere between the 1.2600 base and the channel’s lower band at 1.2560. Running lower, the decline could next take a breather around 1.2485 and then near 1.2400 before touching the 200-day SMA at 1.2325.
Summing up, GBPUSD is showing mixed signals in the short-term picture. A pullback below 1.2740 could dampen market sentiment. Otherwise, the pair may attempt to exit the bearish channel on the upside.
Author

Christina joined the XM investment research department in May 2017. She holds a master degree in Economics and Business from the Erasmus University Rotterdam with a specialization in International economics.


