GBP/USD Charts H&S Top on H1 Timeframe
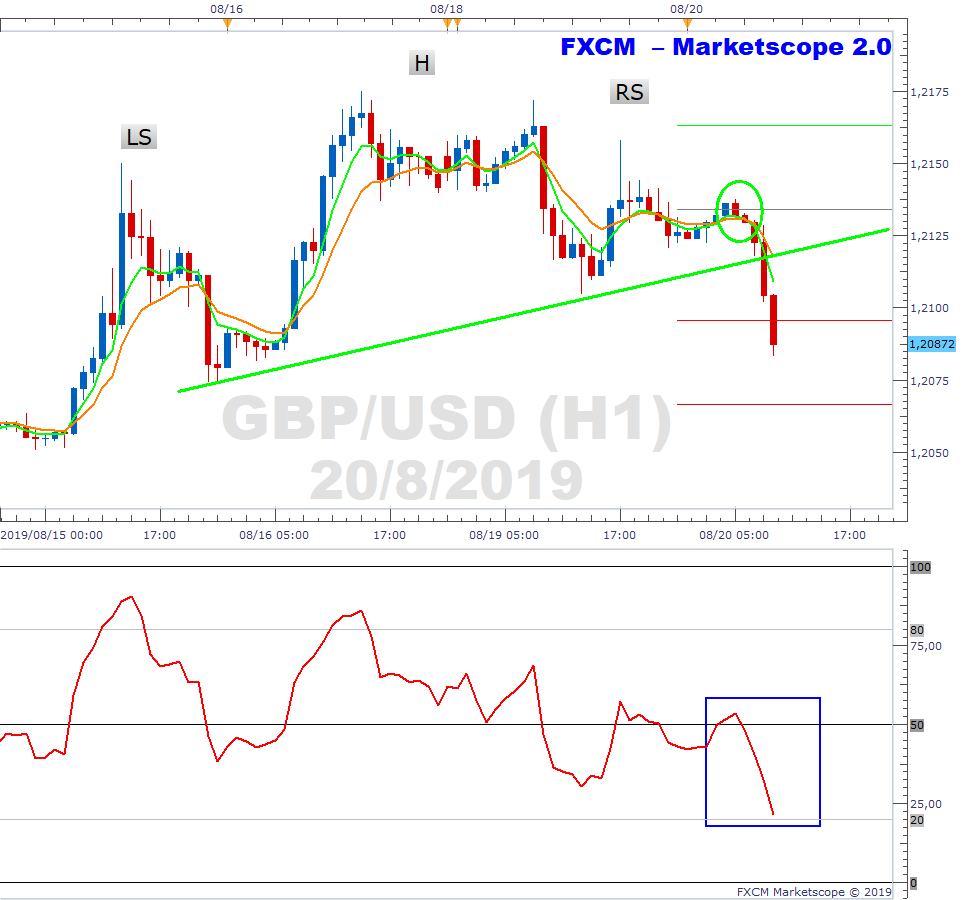
The below is the hourly chart of the GBPUSD. The cable pairing has charted a head and shoulders top. This is generally regarded as a bearish pattern. Moreover, the green 5-hour EMA has dropped below the orange 10-hour EMA (green ellipse) and the RSI has moved below 50 (blue rectangle). The pair has declined as PM Johnson confirms the commitment to deliver Brexit by 31 October. The PM will meet with European leaders this week. However, the price movement suggests that those talks may not go well. We continue to monitor.
Past performance is not an indicator of future results.
CHART SOURCE: FXCM MARKETSCOPE 2.0
Author

Russell Shor (MSTA, CFTe, MFTA) has an Honours Degree in Economics from the University of South Africa and holds the coveted Certified Financial Technician and Master of Financial Technical Analysis qualifications from the Interna


