GBP/USD breaking support and looking lower – Elliott wave analysis

Hello traders,
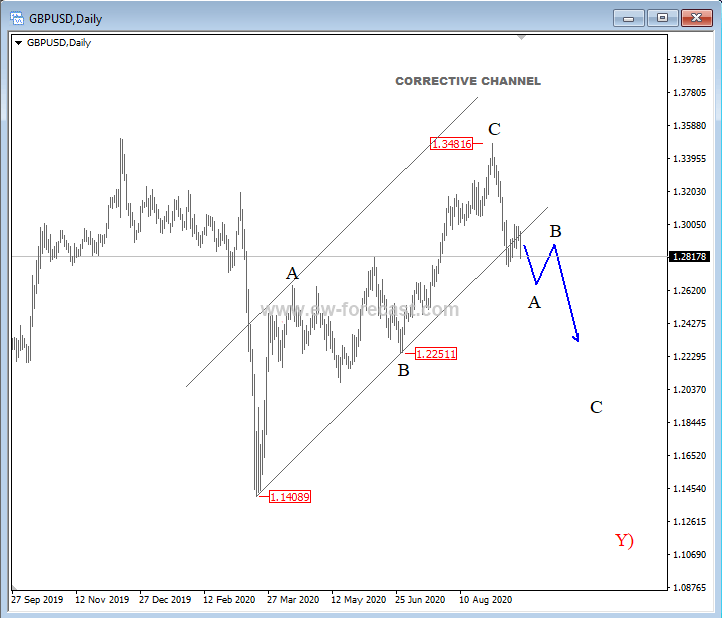
GBPUSD made a three-wave, A-B-C corrective move, up from the 1.140 level which can be labelled as a wave X), which is part of a bigger, corrective move. We can see that price completed A-B-C legs in X), and found resistance at the 1.348 level, just below the upper corrective channel line, and started sharply turning. An impulsive turn can be in play, which is now also pointing below the lower corrective channel line, which is first evidence for further weakness to follow, ideally in a three-wave move for wave Y). That said, for further evidence that wave Y) is in play we would like to see a break below the 1.225 level.
GBP/USD, daily
Want more Elliott Wave Analysis on a daily basis? Click Here And Try our services for 7 Days
Author

Gregor Horvat
Wavetraders
Experience Grega is based in Slovenia and has been in the Forex market since 2003.


