GBP/USD Forecast: Sterling pulls back before targeting 100-DMA
- The GBP/USD is set to target resistance at 100-day moving average (DMA) of 1.3180 before pulling lower.
- The UK inflation is expected to decelerate unaltering the monetary policy outlook with Brexit headlining the economic risk.
- Brexit headlines with EU chief Brexit negotiator Michel Barnier expecting 6-8 weeks before reaching the Brexit agreement and the US inflation slowing down pushed GBP/USD to a 6-week high of 1.3139 over the second week of September.
- The FXStreet Forecast Poll turned decisively bullish short-term with most of the forecasters expecting GBP/USD to stabilize around 1.3100 level at the time of key Brexit decisions.

The second week of September was remarkable for Sterling with daily gains in every single day of the week to the 6-week high of 1,3139 on Friday. The US Dollar finally took over and strengthened on Friday backed by solid consumer confidence, but Sterling still gained some 1.3% over the week. With the Bank of England turning to a non-event with both policy rates and policy outlook unchanged, it was the Brexit headlines and the unexpectedly strong deceleration in the US inflation that was moving the market.
The GBP/USD currency pair moved from the opening level near 1.2910 on Monday to a six-week high of 1.3139 to end the second week of September above 1.3100.
Sterling benefitted from the UK and the US macro news over the second week of September. The UK labor market report came out on the stronger than expected side with wages rising above expectations and gave Sterling an initial boost.
The UK wage growth
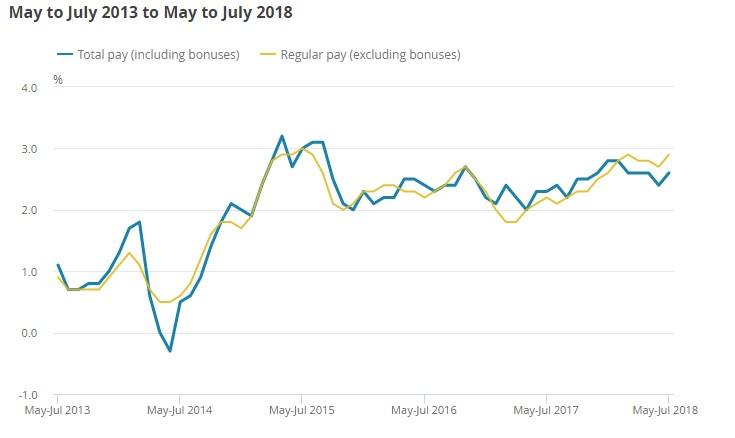
The news on UK wages came after the news of both the European Union chief Brexit negotiator Michel Barnier and the European Commission President Jean-Claude Juncker confirmed that the Brexit deal is achievable within 6-8 weeks. The Bank of England Governor Mark Carney confirmed that the recent economic data support the prediction for faster pay growth in the UK while giving a Whitaker Lecture, in the Bank of Ireland in Dublin the day after Bank of England monetary policy meeting.
While the Bank of England turned to be a non-event, Sterling was massively boosted by the US Dollar re-pricing in the aftermath of the US inflation report on Thursday. The US headline and core inflation decelerated below market expectations to 2.5% y/y and 2.2% y/y respectively with the FX market discounting the chances Fed hiking rates four times lower.
Technically, the picture on GBP/USD is positive, with the currency pair moving in the upward trending pattern. With the market breaking above the FXStreet technical confluences indicator showing a cluster of technical levels around 1.3030-1.3050 the level of 1.3180 a new target on the upside. The 1.3180 level represents an important resistance zone because it matches the 50% Fibonacci retracement of Sterling rising from 1.2030 to a cyclical high from April 17 at 1.4377. The 55-period moving average still acts as an active support along with the trendline staring at last week’s low of 1.2785. On the downside, 1.3050 is an immediate support before 1.3000 is tested.
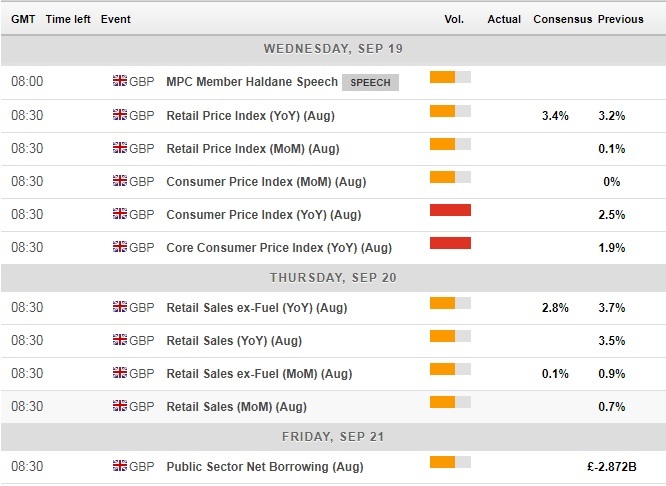
The fundamental news in the week ahead is unlikely to drive Sterling much higher, as the UK inflation is expected to have decelerated in August to 2.4% y/y and the Bank of England chief economist Andrew Haldane’s speech at the 100th anniversary of Swedish Riksbank is expected to be rather ceremonial. The UK retail sales and the public sector net borrowing are similarly to inflation data unlikely to decisively move Sterling in an environment of the Brexit news sensitive market even as core retail sales are expected to decelerate strongly to 0.1% m/m in August.
Technical analysis
GBP/USD daily chart
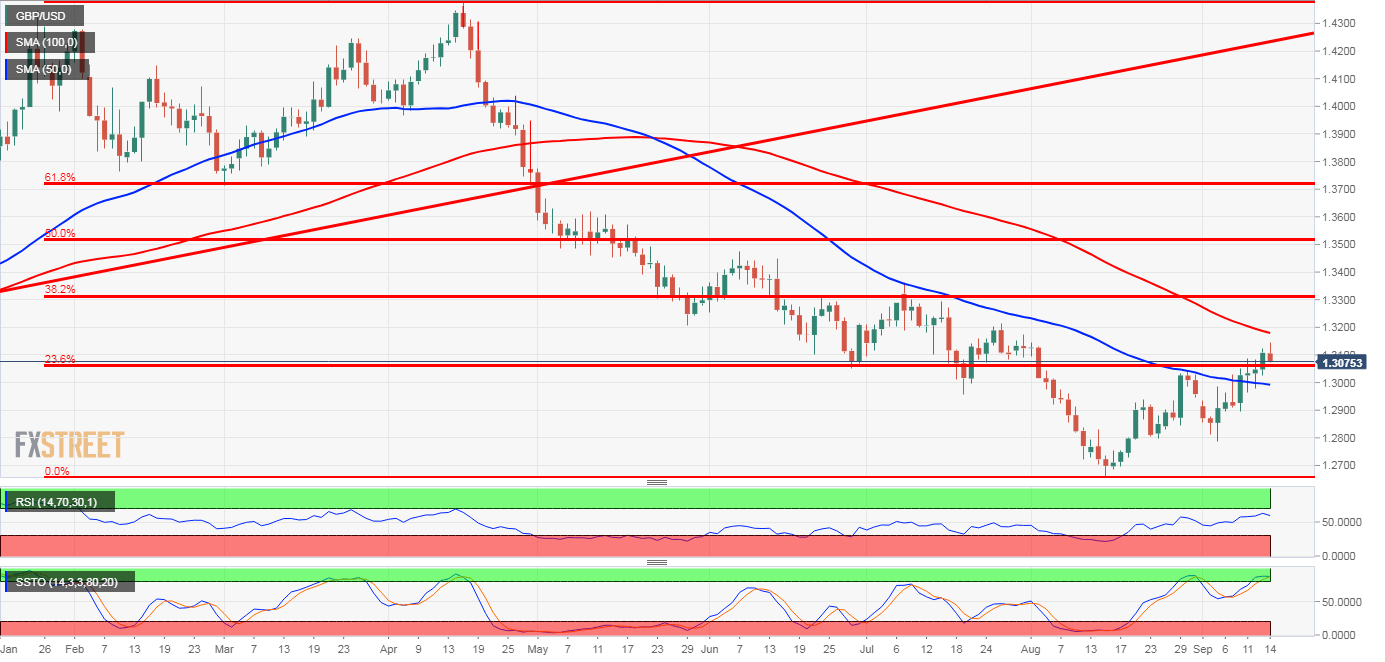
The GBP/USD is trading in the upward trending channel. The currency pair has broken a resistance zone at 1.3050-1.3060 and rose over the second week of September to a 6-week high of 1.3139 from which it pulled back lower to 1.3088. The 1.3050-1.3060 former resistance and now the support level representing 26.3% Fibonacci retracement of a slide from 2018 high of 1.4377 to a cyclical low and 2018 low of 1.2662. The technical oscillators are elevated with both the Relative Strength Index and Slow Stochastics flatlining, indicating possible pullback lower towards 1.3060 and 1.3000 next. On the upside, the 1.3090 representing a level of 100-day moving average is an immediate resistance.
GBP/USD 1-hour chart
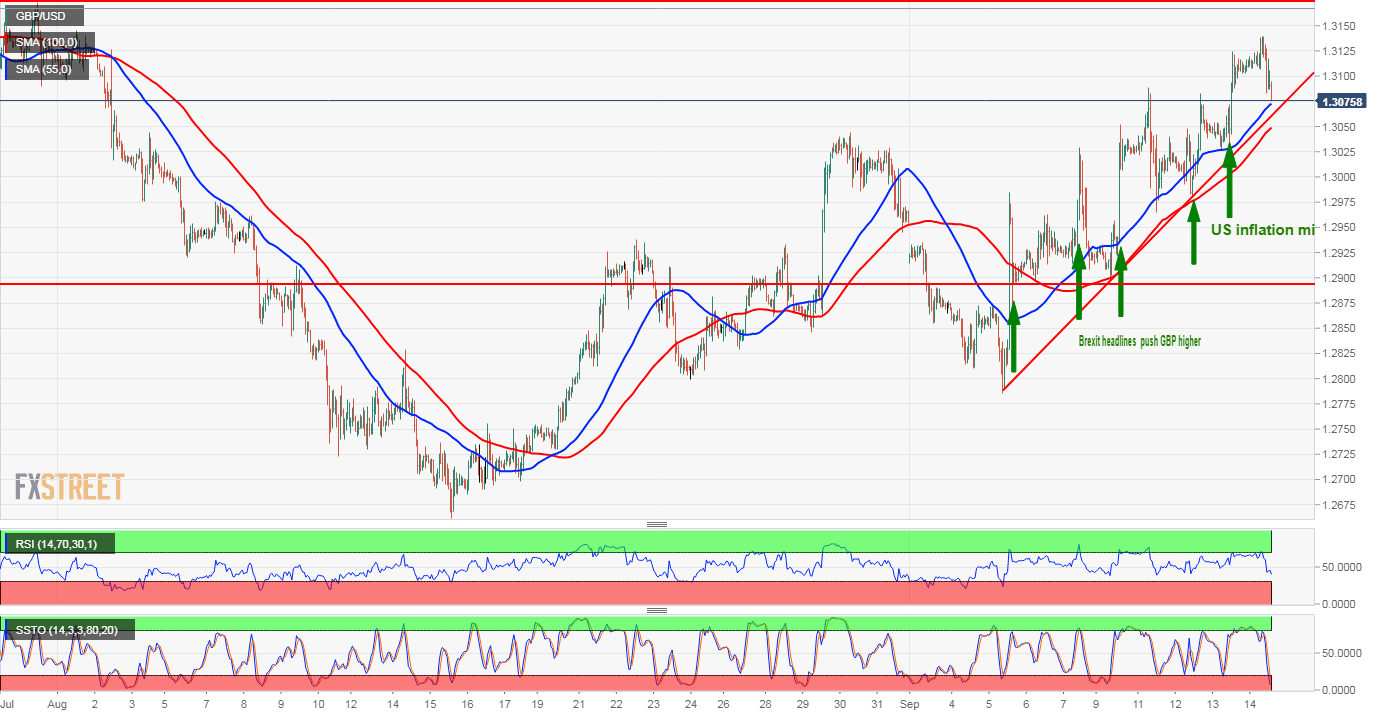
On a 1-hour chart, the picture on GBP/USD is positive, with the currency pair moving in the upward trending pattern. With the market breaking above the FXStreet technical confluences showing a cluster of technical levels around 1.3030-1.3050 the level of 1.3180 a new target on the upside. The 1.3180 level represents an important resistance zone because it matches the 50% Fibonacci retracement of Sterling rising from 1.2030 to a cyclical high from April 17 at 1.4377. The 55-period moving average still acts as an active support along with the trendline staring at last week’s low of 1.2785. On the downside, 1.3050 is an immediate support before 1.3000 is tested.
Next week in economic data
The UK economic calendar is featuring inflation and retail sales data while the Bank of England chief economist Andy Haldane is scheduled to speak. The data in the UK are also complemented by UK public sector net borrowing data.
While both UK headline and core inflation are expected to decelerate slightly, the relevance of the inflation data relative to the monetary policy is belittled by the fact that the Bank of England hiked the Bank rate at the beginning of August with next move expected in May 2019. Higher inflation would be slightly Sterling boosting, but with the deadline for Brexit nearing, headlines concerning Brexit rule the market.
The same analogy applies to the UK retail sales that are expected to have decelerated in August to 0.1% m/m afte unexpectedly strong increase of 0.9% in July.
UK economic calendar for September 17-21
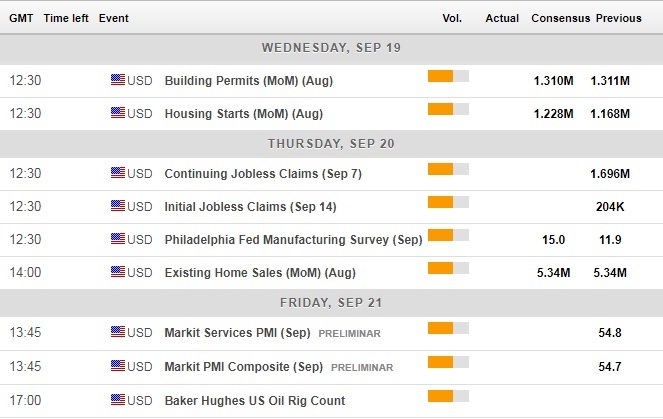
On the other side of the Atlantic, calendar during the third week of September is also light. The US will see housing market data and the weekly initial jobless claims. The FX market though expects the Federal Reserve to hike the Fed funds range by 215 basis points during the fourth week of September so this is certainly being priced in and counted with, regardless of the US inflation unexpectedly decelerating in August.
US economic calendar for September 17-21
FXStreet Forecast Poll
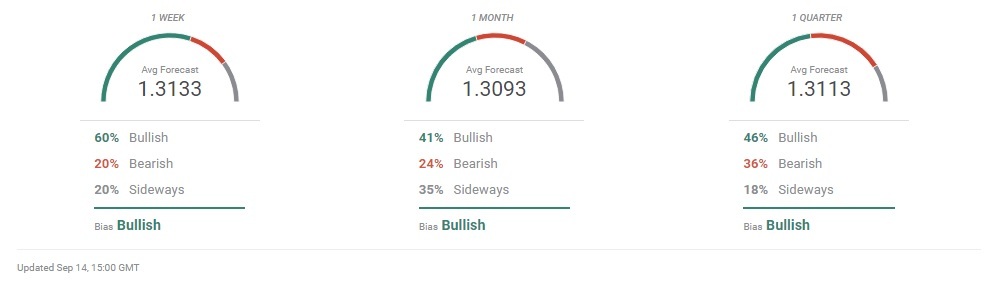
The FXStreet Forecast Poll confirmed a bullish outlook for the third week in a row now. The forecasters expect bullish trend to continue in the third week of September expecting 1.3133 by Friday next week compared to 1.2965 exchange rate expected in 1-week time last week. While 60% of forecasters expect bullish trend to prevail, there are only 20% predicting bearish trend and 20% envisaging sideways trend for the week ahead.
With Sterling breaking above 1.3000 level decisively, the longer-term forecasts lost previous stability with the FXStreet Forecast Poll expecting 1.3093 forecast for 1-month compared to 1.2950 in 1-month time from now last week. The bullish trend is expected by 41% of forecasters, while 24% expect bearish trend and 35% expect the sideways trend to prevail in 1-month time from now.
The FXStreet Forecast Pollfor 3-months ahead is a bit more bullish with forecasters expecting 1.3113 compared to 1.3074 level last week. Only 46% of forecasters expect bullish trend Compared to last week’ s 58%. Forecasters thus expect Sterling to stabilize around 1.3100 level until Brexit deal is decided upon.
Related articles
Author

Mario Blascak, PhD
Independent Analyst
Dr. Mário Blaščák worked in professional finance and banking for 15 years before moving to journalism. While working for Austrian and German banks, he specialized in covering markets and macroeconomics.

















