GBP/USD outlook: Bears eye a failed breakout on the cable

The GBP/USD has been consolidating around the major resistance level at 1.31300 since the beginning of August, without being able to break out above it decidedly. In fact, there have been at least eight separate attempts of the price action at advancing above the resistance, all which came to no avail.
This protracted struggle of the British pound exemplifies diminishing bullish bias in the market and could be perceived as an early indication of a possible trend reversal.
The surprising jump of the British inflation rate to 1 per cent in July contributed to the most significant attempt at forming a breakout, which can be seen on the charts below. The upswing took place on the 18th of August. However, this upsurge proved to be short-lived as the cable then quickly retreated.
This is partly owing to the baseline scenario projected by the BOE concerning Britain's economic prospects throughout 2020. They envision a very probable seesaw effect in the underlying British price stability, causing the inflation rate to once again fall to near-negative levels by the end of the year. The market subsequently reacted to these developments by pricing in a likely devaluation of the pound in the forthcoming weeks.
Meanwhile, the dollar has been advancing since last week after having plummeted considerably beforehand. The rally of the greenback ahead of the Jackson Hole symposium, which is going to be held later this week, can be attributed to two crucial developments. Firstly, to the inroad that has been made towards the development of a Covid-19 vaccine. Secondly, to traders' anticipations regarding the upcoming speech of Jerome Powell on Thursday. The Chair of the Federal Reserve is due to review the 'Monetary Policy Framework' in the US.
The purpose of today's analysis is to examine the impact of these changing fundamentals on the technical outlook of the GBP/USD pair. In other words, to delineate on how the most recent trends in the global economy could prompt the cable to form a new bearish correction.
Long-Term Outlook:
The daily chart below exemplifies the aforementioned consolidation of the price action below the major resistance level at 1.31300. The high levels of uncertainty above the latter stymied the continuation of the bullish trend further north. The quick succession of four Marabozu candlesticks - two bullish and two bearish ones – led to the retracement of the price action back below the resistance, which represents a major trend reversal signal.
Notice that yesterday's candle represents a shooting star, which typically signifies rising bearish sentiment and signals a likely reversal. This is congruent with the primary expectations. Moreover, the shooting star tested the major resistance level and the two moving averages – the 10-day MA (in orange) and the 10-day EMA (in blue) – before closing below the three. This behaviour represents a retracement following a major breakdown and could be interpreted as an early stage in the establishment of a new, significant downswing.
Today's price action tested the two moving averages, which have now adopted the functions of floating resistances, for a second time. All of these developments seem to be parts in the establishment of a massive, trend reversal. The first logical target-level for such a newly emerging downswing is encapsulated by the 23.6 per cent Fibonacci retracement level at 1.28278.
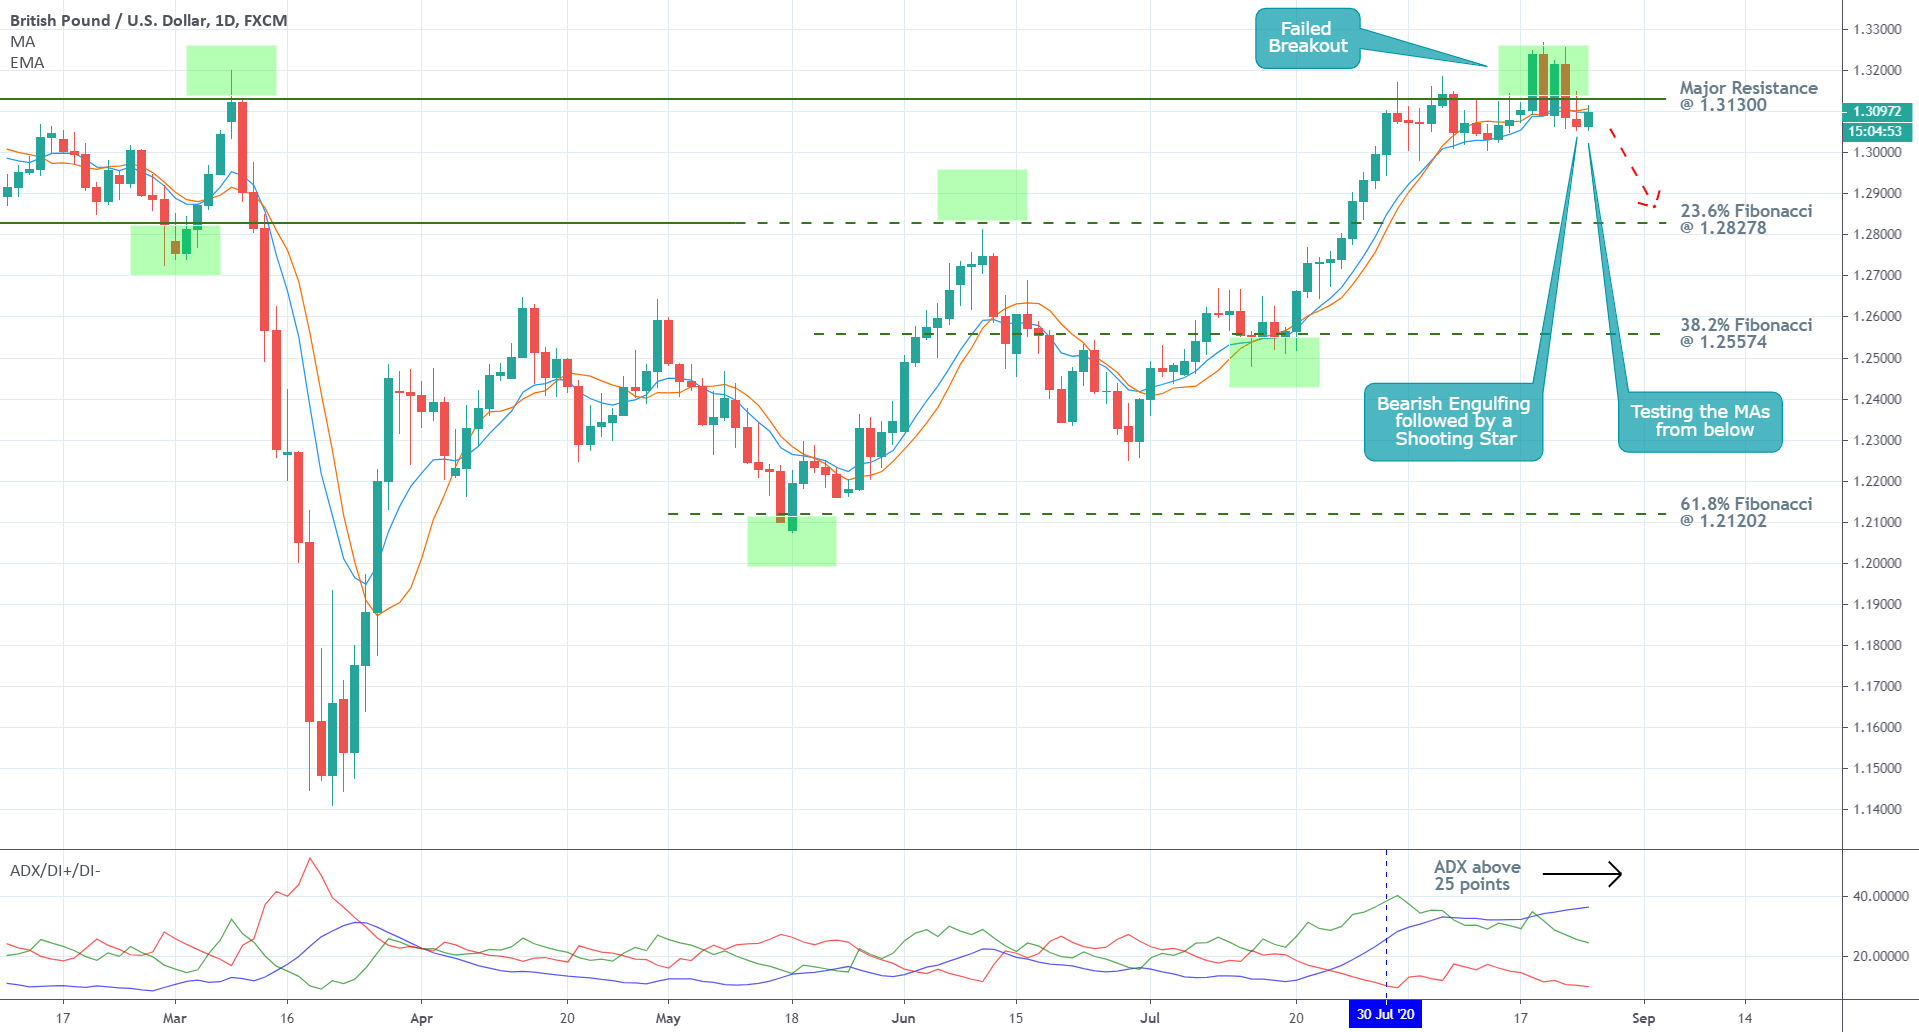
The ADX indicator has been threading above the 25-point benchmark since the 30th of July, which means that the market is technically trending. However, it should be noted that the indicator's reading broke above this important threshold just as the price action started testing (and failing) to break out above the major resistance level at 1.31300.
What this disparity entails is that the underlying bullish trend appears incapable of continuing its development, which is congruent with the previous assertions. Hence, the likelihood of a trend reversal around the current market price is heightened.
Short-Term Outlook:
The 4H chart below demonstrates the manner in which the market is developing the next downswing. As can be seen, the price action has established consecutively lower peaks. Moreover, it broke down below the base line and also below the conversion line of the Ichimoku Cloud indicator, which represents yet another piece of evidence supporting the primary expectations.
The cloud itself has adopted a new role following the breakdown – that of a floating resistance. This is especially important given that the cloud is currently positioned just above the 1.31300 resistance. All of this signifies an exciting new trend – each subsequent wave that is formed by the price action is looking increasingly more bearish.
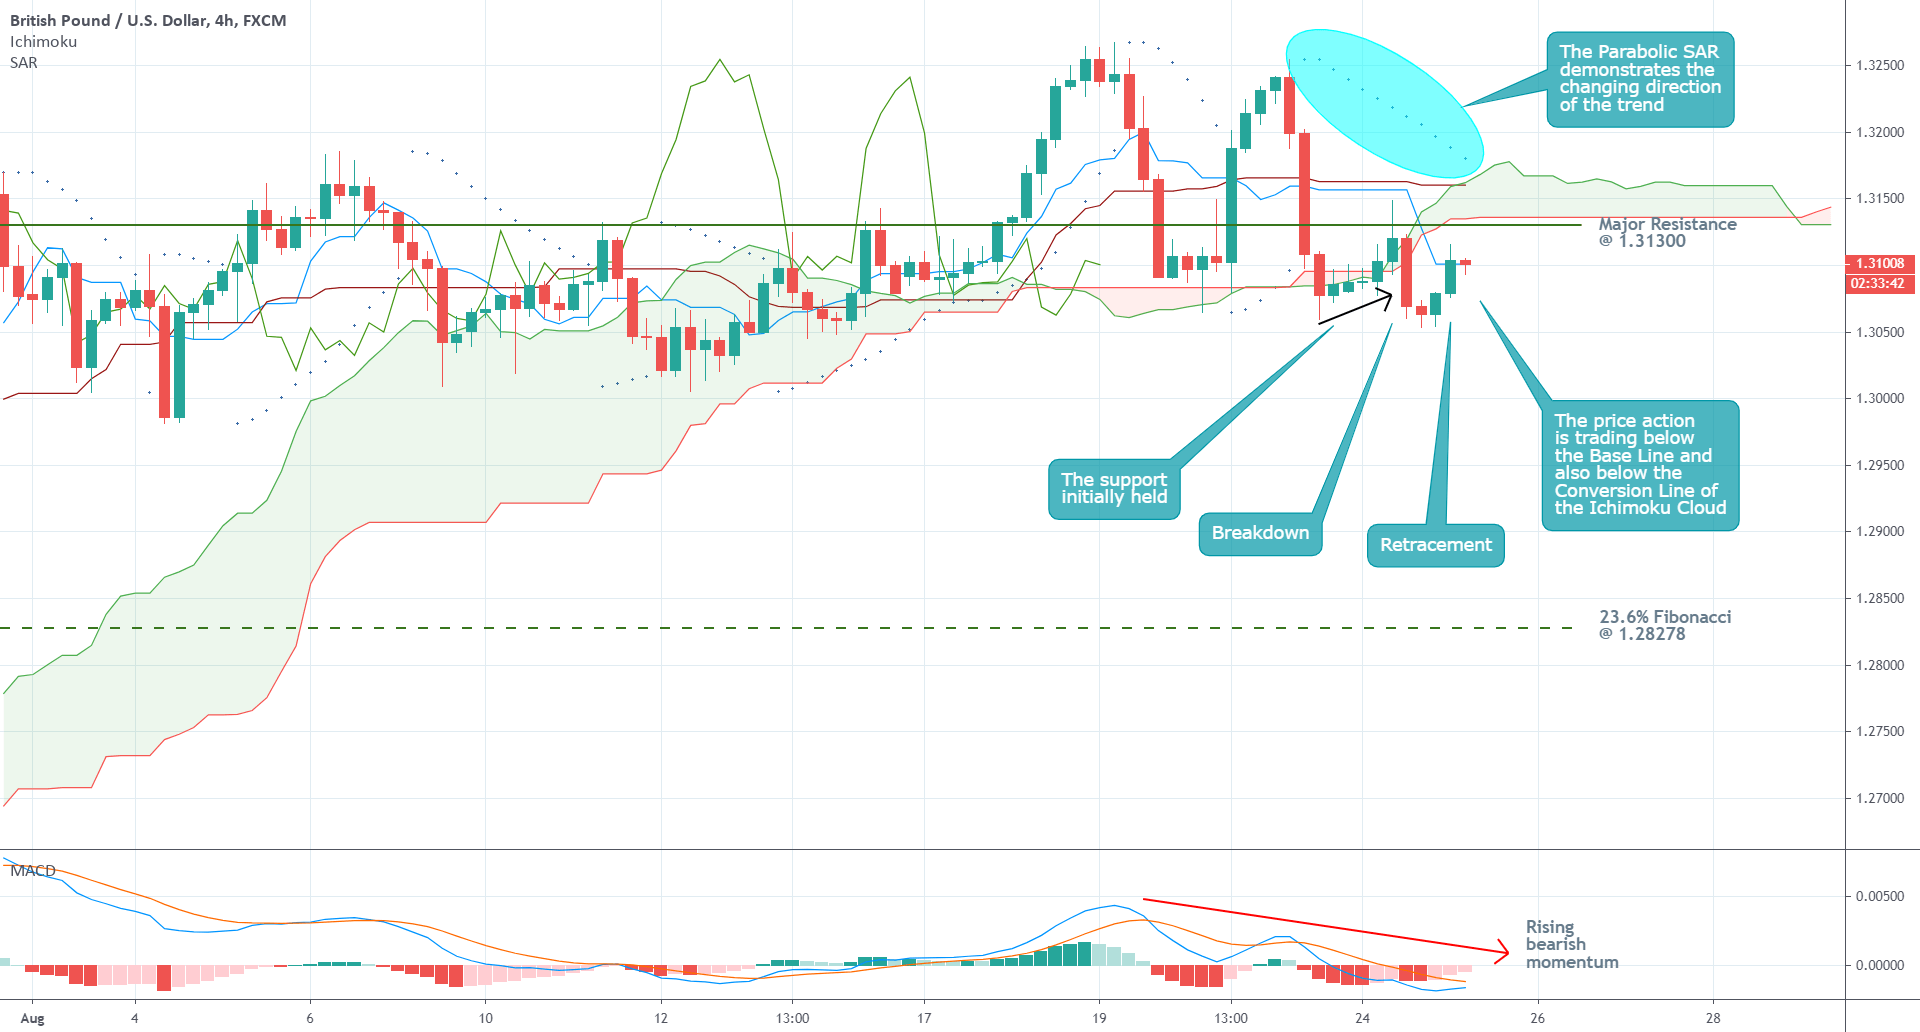
Furthermore, the Parabolic SAR indicator has already discounted a likely reversal in the underlying direction of the price action. Additionally, the MACD is confirming the rising bearish momentum. There is a confluence of the underlying pieces of evidence signalling the increasing bearish bias.
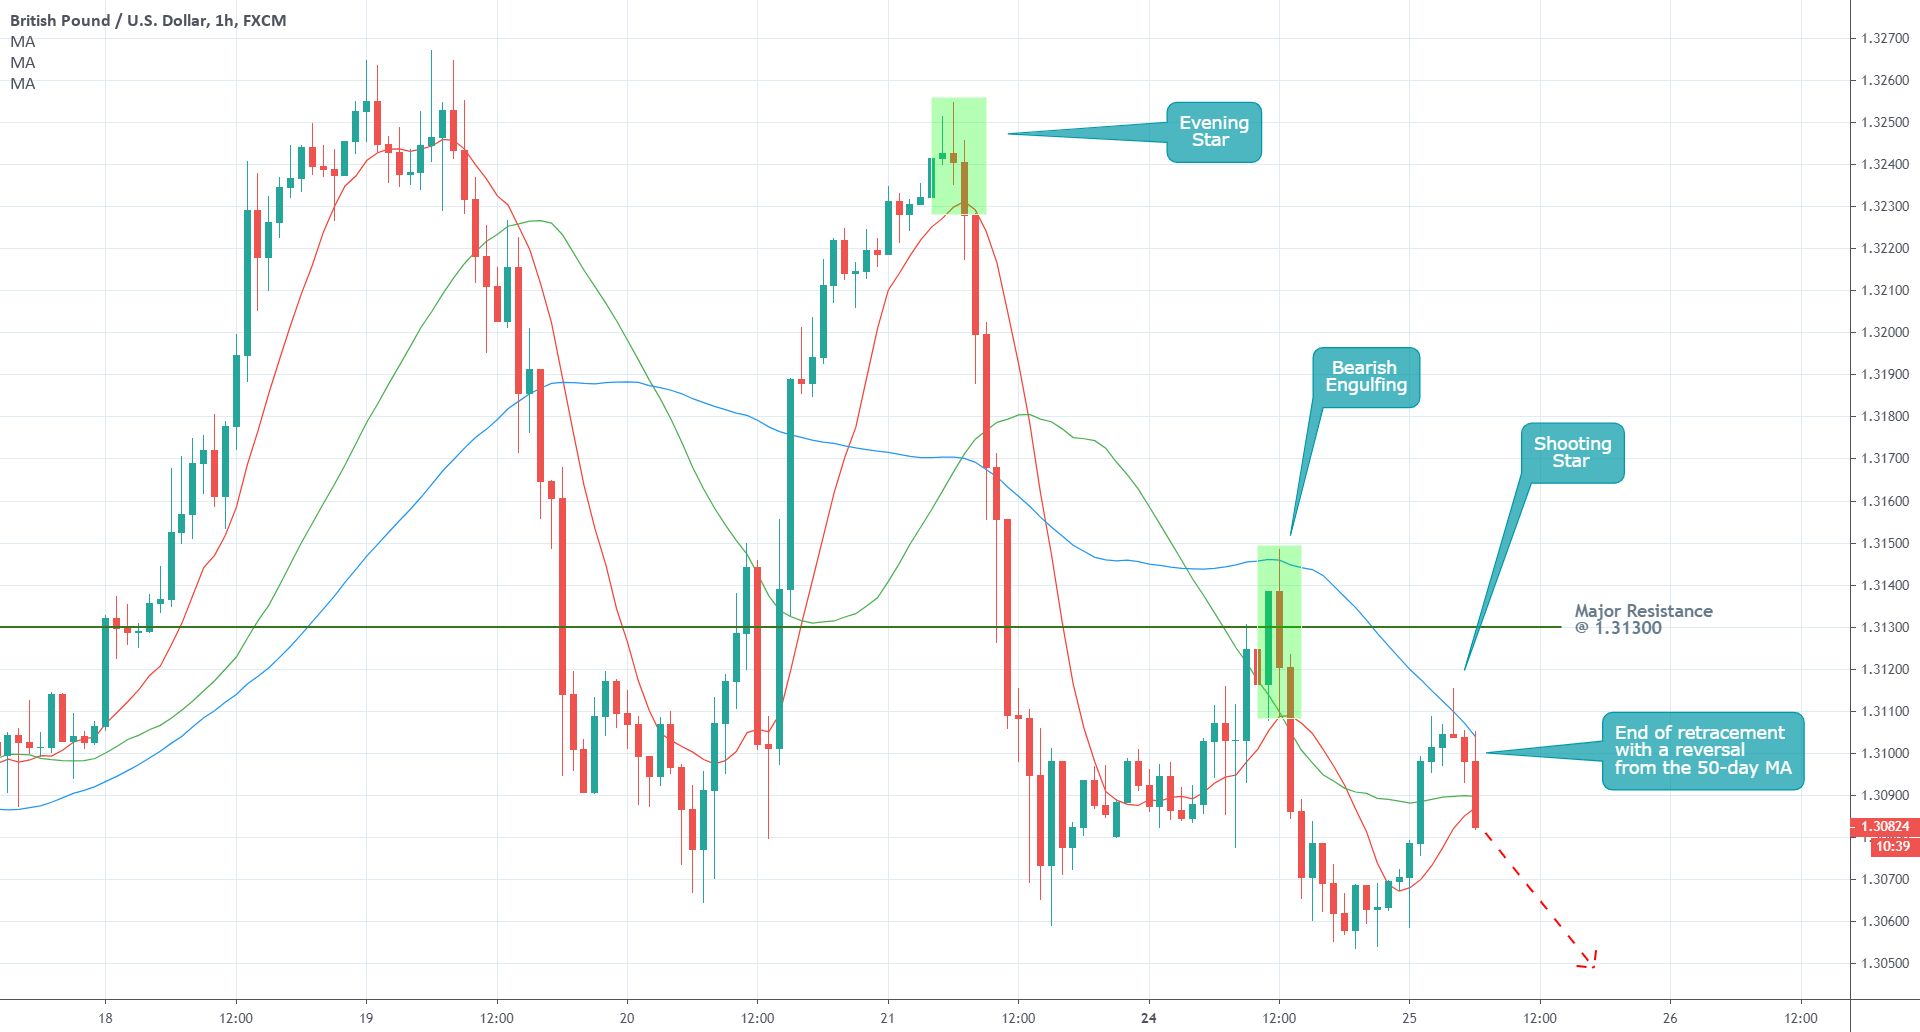
As regards the immediate short-term, the minor bullish retracement already looks terminated. The price action remains concentrated below the 50-day MA (in blue). Moreover, the 10-day MA (in red) is positioned below the 30-day (in green), which is trading below the 50-day MA. This order also confirms the rising bearish sentiment.
Finally, it is also worth noting that the price action has established prominent types of candles on each peak, which manifests the bearish orientation of the market.
Concluding Remarks:
The protracted Brexit woes for Britain coupled with muted inflationary pressures and the reinvigorated strength of the greenback, underline the potential for a trend reversal on the cable.
The price action has been unable to continue advancing further north throughout the month of August, which underpins an ongoing change in the underlying market sentiment. The market could continue consolidating around the major resistance level at 1.31300 in the immediate future, however, the longer-term projections anticipate the development of a massive dropdown.
Author

Plamen Stoyanov
Trendsharks
Plamen started his career on the global capital markets in 2012 when he began trading with financial derivatives.


