GBP/USD looks vulnerable after the Fed, ahead of the BOE — Confluence Detector


GBP/USD has probably ended its recovery after the Federal Reserve has dampened hopes for a long cycle of rate cuts and sent the dollar higher. GBP/USD now faces the Bank of England's decision later today. How is cable positioned? 

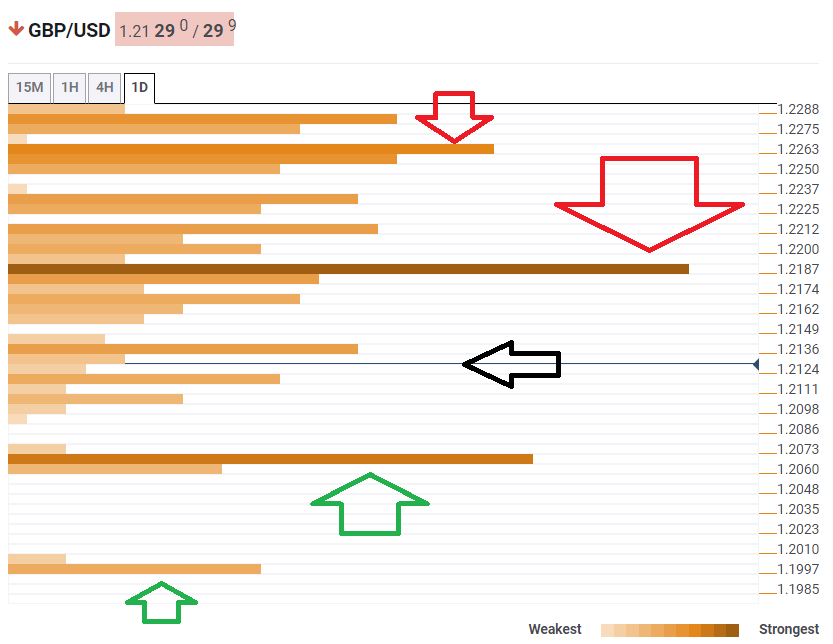
We can see how resistance is stronger than support.

The Technical Confluences Indicator is showing that GBP/USD is currently trading between 1.217 and 1.2136 where we see several technical lines holding the currency pair stable. These include the previous daily low, the Bollinger Band 15min-Upper, the Simple Moving Average 10-15m, the Pivot Point one-day Support 1, and more.

Support awaits at 1.2066 which is the convergence of the Fibonacci 161.8% one-day, the Pivot Point one-day Support 2, and the Bollinger Band 4h-Lower.

Further down, only weak support awaits at 1.1197 where the Pivot Point one-day Support 3 meets the price.

Looking up, fierce resistance awaits at 1.2187 which is the confluence of the Pivot Point one-week Support 3, the Fibonacci 61.8% one-day, the Bollinger Band 1h-Middle, and more.

Further above, 1.2263 is a high upside target and is where the Fibonacci 23.6% one-month, the SMA 100-1h, the BB 1h-Upper, and the previous daily high.

This is how it looks on the tool:

GBP USD August 1 2019 technical confluence

Confluence Detector

The Confluence Detector finds exciting opportunities using Technical Confluences. The TC is a tool to locate and point out those price levels where there is a congestion of indicators, moving averages, Fibonacci levels, Pivot Points, etc. Knowing where these congestion points are located is very useful for the trader, and can be used as a basis for different strategies.

This tool assigns a certain amount of “weight” to each indicator, and this “weight” can influence adjacents price levels. This means that one price level without any indicator or moving average but under the influence of two “strongly weighted” levels accumulate more resistance than their neighbors. In these cases, the tool signals resistance in apparently empty areas.

Learn more about Technical Confluence

Information on these pages contains forward-looking statements that involve risks and uncertainties. Markets and instruments profiled on this page are for informational purposes only and should not in any way come across as a recommendation to buy or sell in these assets. You should do your own thorough research before making any investment decisions. FXStreet does not in any way guarantee that this information is free from mistakes, errors, or material misstatements. It also does not guarantee that this information is of a timely nature. Investing in Open Markets involves a great deal of risk, including the loss of all or a portion of your investment, as well as emotional distress. All risks, losses and costs associated with investing, including total loss of principal, are your responsibility. The views and opinions expressed in this article are those of the authors and do not necessarily reflect the official policy or position of FXStreet nor its advertisers. The author will not be held responsible for information that is found at the end of links posted on this page.

If not otherwise explicitly mentioned in the body of the article, at the time of writing, the author has no position in any stock mentioned in this article and no business relationship with any company mentioned. The author has not received compensation for writing this article, other than from FXStreet.

FXStreet and the author do not provide personalized recommendations. The author makes no representations as to the accuracy, completeness, or suitability of this information. FXStreet and the author will not be liable for any errors, omissions or any losses, injuries or damages arising from this information and its display or use. Errors and omissions excepted.

The author and FXStreet are not registered investment advisors and nothing in this article is intended to be investment advice.

Recommended Content


Recommended Content

Editors’ Picks

AUD/USD stalls ahead of Reserve Bank of Australia’s decision

AUD/USD stalls ahead of Reserve Bank of Australia’s decision

The Australian Dollar registered minuscule gains compared to the US Dollar as traders braced for the Reserve Bank of Australia monetary policy meeting. A scarce economic docket in the United States and a bank holiday in the UK were the main drivers behind the “anemic” AUD/USD price action. The pair trades around 0.6624.

AUD/USD News

USD/JPY extends recovery above 154.00, focus on Fedspeak

USD/JPY extends recovery above 154.00, focus on Fedspeak

The USD/JPY pair trades on a stronger note around 154.10 on Tuesday during the Asian trading hours. The recovery of the pair is supported by the modest rebound of US Dollar to 105.10 after bouncing off three-week lows. 

USD/JPY News

Gold rises as US job slowdown dampens Treasury yields

Gold rises as US job slowdown dampens Treasury yields

Gold price rallied close to 1% on Monday, late in the North American session, bolstered by an improvement in risk appetite due to increased bets that the US Federal Reserve might begin to ease policy sooner than foreseen. The XAU/USD trades at around $2,320 after bouncing off daily lows of $2,291. 

Gold News

TON crosses $200 million in Total Value Locked as its network integration continues to scale

TON crosses $200 million in Total Value Locked as its network integration continues to scale

In a recent development, the TON network surpassed $200 million in total value locked on Monday after seeing a major boost through The Open League reward program.

Read more

RBA expected to leave key interest rate on hold as inflation lingers

RBA expected to leave key interest rate on hold as inflation lingers

Interest rate in Australia will likely stay unchanged at 4.35%. Reserve Bank of Australia Governor Michele Bullock to keep her options open. Australian Dollar bullish case to be supported by a hawkish RBA.

Read more

Majors

Cryptocurrencies

Signatures