GBP/USD Impulsive Bearish Break Aims at 1.2750 Target

The GBP/USD made a critical bearish breakout below the support trend lines (dotted blue). This indicates a strong downtrend continuation.

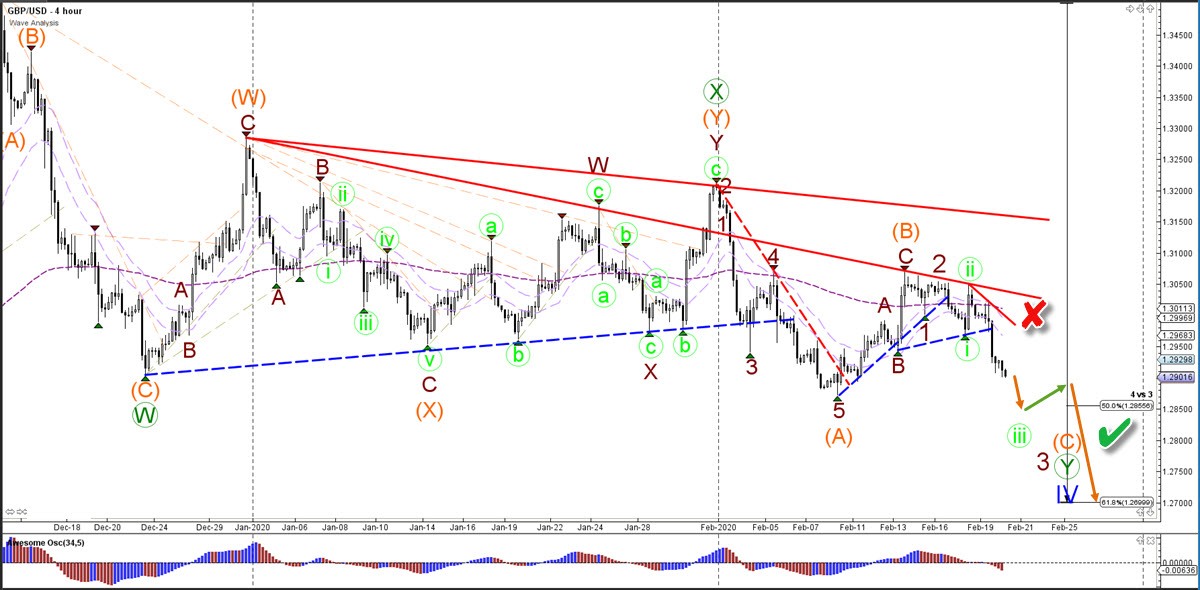
4 hour chart
The GBP/USD was building a bull flag pattern, but the chart pattern failed to break north. The lower low is now confirming a bearish ABC (orange) zigzag pattern instead. The bears are aiming for the 61.8% Fibonacci level of wave 4 vs 3. The 61.8% Fib is the last defense of the bulls for this wave 4 (blue).
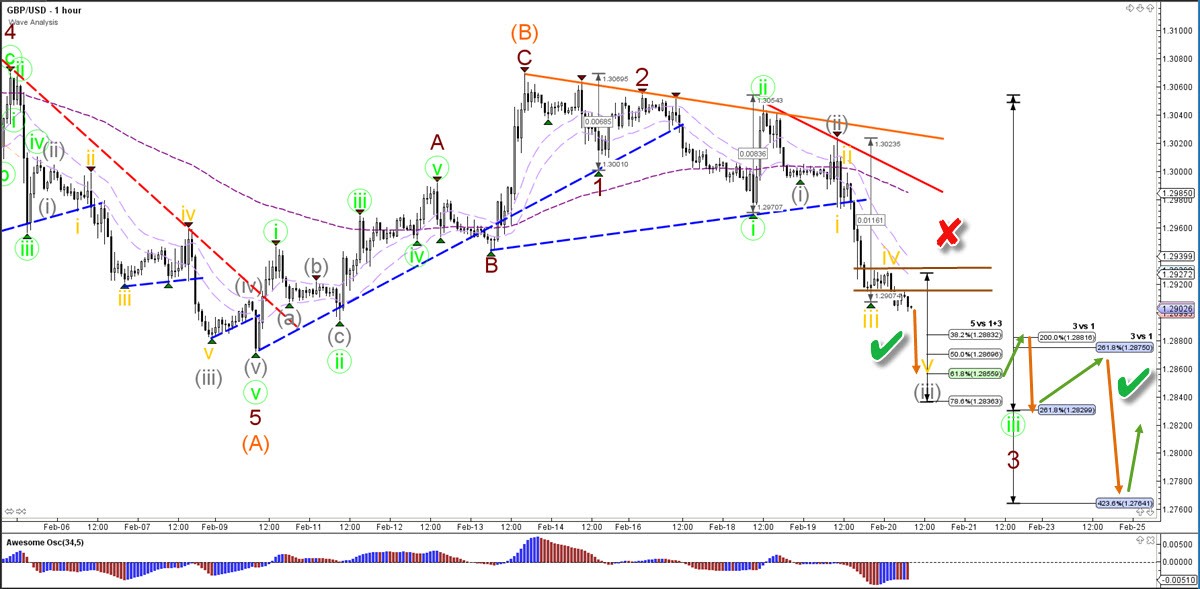
1 hour chart
The GBP/USD is showing strong bearish momentum. This is typical for a wave 3 (gold). The breakout below 1.29 should send price towards the Fibonacci targets. Multiple wave 3-4-5 patterns can form them, which could send price all the way to 1.2750. A break above 1.2950 is not expected (red x).
The analysis has been done with the CAMMACD.Core System.
For more daily technical and wave analysis and updates, sign-up up to our ecs.LIVE channel.
Author

Chris Svorcik
Elite CurrenSea
Experience Chris Svorcik has co-founded Elite CurrenSea in 2014 together with Nenad Kerkez, aka Tarantula FX. Chris is a technical analyst, wave analyst, trader, writer, educator, webinar speaker, and seminar speaker of the financial markets.


