|

GBP/USD Impulse Breaks Support of Wedge Pattern

Hi traders,

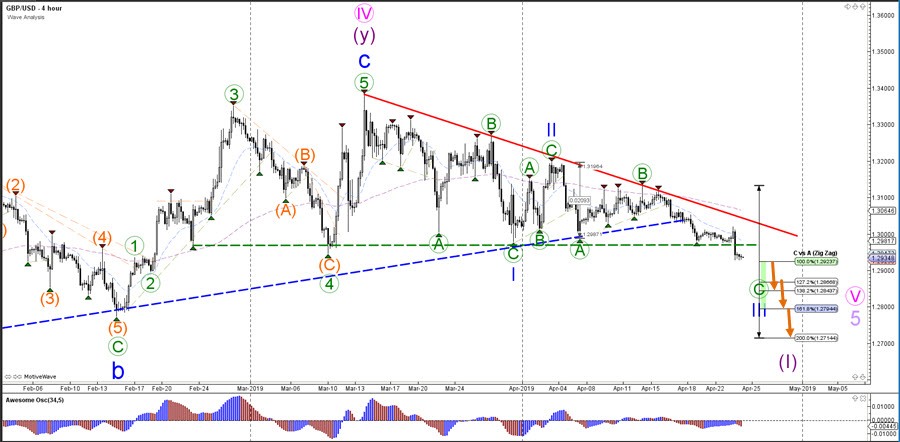
the GBP/USD broke below the key support trend line (dotted green) and 1.2950-1.30 support zone of the descending wedge, which could indicate the start of a bearish breakout.

GBP/USD

4 hour

The GBP/USD seems to be building multiple ABC zigzag patterns (green) which could indicate a potential leading diagonal within wave 1 (purple). For the moment bearish momentum is dominating the chart and a break below the 100% Fibonacci level could indicate a continuation towards the next Fibonacci targets.
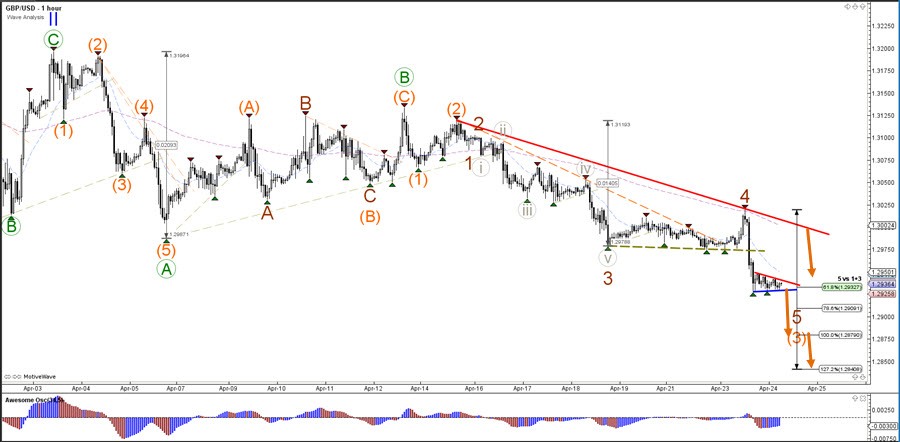
1 hour

The GBP/USD bearish breakout made the previous wave 4 pattern unlikely. The current wave outlook favors a bearish count with a potential wave 5 (dark red) within wave 3 (orange) if price manages to break below the support trend line (blue).

The analysis has been done with the CAMMACD.MTF template.

For more daily technical and wave analysis and updates, sign-up up to our ecs.LIVE channel.

Author

Chris Svorcik

Chris Svorcik

Elite CurrenSea

Experience Chris Svorcik has co-founded Elite CurrenSea in 2014 together with Nenad Kerkez, aka Tarantula FX. Chris is a technical analyst, wave analyst, trader, writer, educator, webinar speaker, and seminar speaker of the financial markets.

More from Chris Svorcik
Share:

Editor's Picks

EUR/USD: US Dollar to remain pressured until uncertainty fog dissipates

Unimpressive European Central Bank left monetary policy unchanged for the fifth consecutive meeting. The United States first-tier employment and inflation data is scheduled for the second week of February. EUR/USD battles to remain afloat above 1.1800, sellers moving to the sidelines.

GBP/USD softens to near 1.3600 as BoE hints further rate cuts

The GBP/USD pair loses ground to near 1.3610 during the early Asian session on Monday. The Pound Sterling softens against the Greenback amid growing expectations of the Bank of England’s interest-rate cut. Traders will take more cues from the Fedspeak later on Monday.

Gold holds gains near $5,000 as China's gold buying drives demand

Gold price clings to the latest uptick near $5,000 in Asian trading on Monday. The precious metal holds its recovery amid a weaker US Dollar and rising demand from the Chinese central bank. The delayed release of the US employment report for January will be in the spotlight later this week.

Bitcoin Weekly Forecast: The worst may be behind us

Bitcoin price recovers slightly, trading at $65,000 at the time of writing on Friday, after reaching a low of $60,000 during the early Asian trading session. The Crypto King remained under pressure so far this week, posting three consecutive weeks of losses exceeding 30%.

Weekly column: Saturn-Neptune and the end of the Dollar’s 15-year bull cycle

Tariffs are not only inflationary for a nation but also risk undermining the trust and credibility that go hand in hand with the responsibility of being the leading nation in the free world and controlling the world’s reserve currency.

XRP rally extends as modest ETF inflows support recovery

Ripple is accelerating its recovery, trading above $1.36 at the time of writing on Friday, as investors adjust their positions following a turbulent week in the broader crypto market. The remittance token is up over 21% from its intraday low of $1.12.