GBP/USD Forecast: Sterling fails to break higher, fundamentals fight back, levels to watch
- GBP/USD has declined in response to the risk-averse market mood.
- Higher than expected UK inflation could push the pair higher.
- Wednesday's four-hour chart is painting a mixed picture

The quadruple top has crumbled – yet only temporarily. GBP/USD's move above the stubborn 1.3895 level has proved temporary and so has dollar weakness in response to weaker than expected US inflation figures. On the other side of the pond, UK consumer prices beat estimates – building a fundamental case for bulls.
The greenback first advanced in response to the meager 4% YoY increase in the US Core Consumer Price Index (Core CPI) for August. The 0.1% MoM was the lowest since February and vindicates Federal Reserve Jerome Powell's stance that inflation is transitory.
US Inflation Analysis: Team Transitory wins, dollar loses, why the trend may extend
However, some suspect that the cooldown in prices is due to falling demand, and such concerns of a cooldown weigh on sentiment – boosting the safe-haven dollar. Disappointing Chinese data also dampened the mood, adding to worries of weaker global growth. That mood may change when investors return to their erstwhile instincts of "buy the dip."
US Consumer Price Index: Is stagflation next?
GBP/USD has dropped due to second thoughts about weak US inflation and could rise on parallel UK data. The headline UK CPI jumped from 2% to 3.2% YoY in August, beating estimates of 2.9%. Core CPI also jumped above estimates, reaching 3.1%.
Will that tip the scales toward a rate hike? Bank of England Governor Andrew Bailey said that the Monetary Policy was split on the question if raising borrowing costs has reached its time, and these figures could push it to act sooner rather than later. GBP/USD could rise in response to mere speculation about such a move.
Overall, based on inflation figures only, GBP/USD has room to rise. There are additional factors, such as lingering Brexit issues, uncertainty about US infrastructure spending, and covid, where Britain has fewer cases on a per population basis than the US.
The fundamental bullish case is there – what about the charts?
GBP/USD Technical Analysis
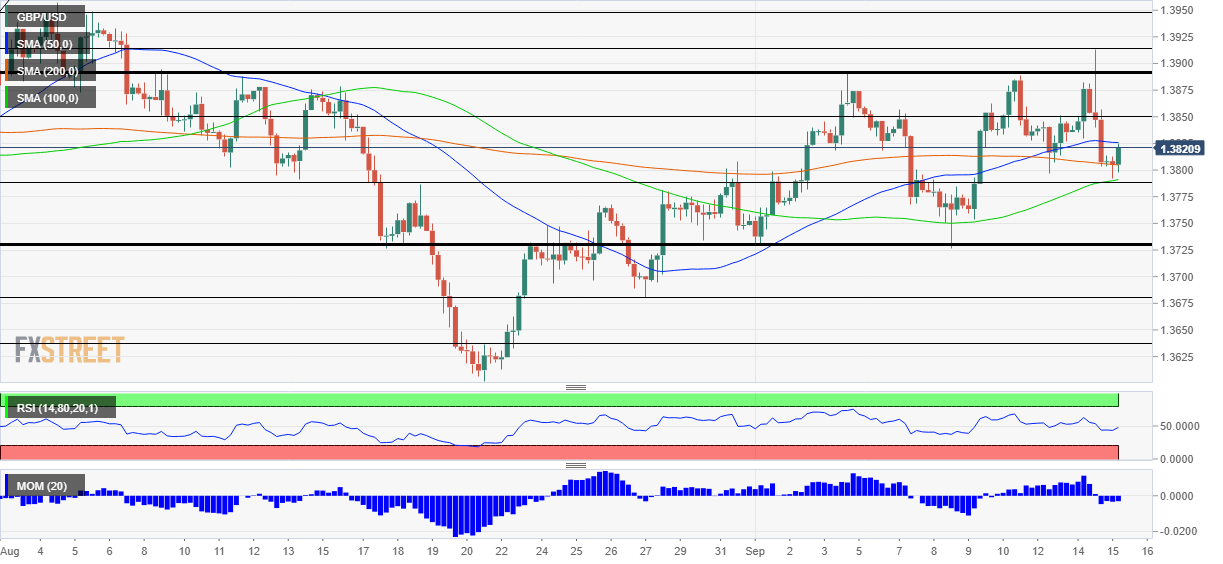
Pound/dollar is suffering from downside momentum on the four-hour chart but trading above the 100 and 200 Simple Moving Averages. The failure to hold above the quadruple top of 1.3895 sent the pair back to the middle of the all-too-familiar 1.3725-1.3895 range, where it seems balanced.
Support awaits at 1.3790, the daily low, and then by 1.3725 mentioned earlier. Further down, the next lines to watch are 1.3680 and 1.3635.
Cable is capped at 1.3850, ahead of the 1.3895 level mentioned earlier. Further above, Tuesday's swing high of 1.3915 is the next line to wach.
Premium
You have reached your limit of 3 free articles for this month.
Start your subscription and get access to all our original articles.
Author

Yohay Elam
FXStreet
Yohay is in Forex since 2008 when he founded Forex Crunch, a blog crafted in his free time that turned into a fully-fledged currency website later sold to Finixio.


