GBP/USD Forecast: Buyers hesitate ahead of key US data
- GBP/USD has lost its traction following a failed attempt to break above 1.2500.
- The pair continues to trade above important support area.
- GBP/USD could try to claim on a soft US GDP print.

GBP/USD has retreated below 1.2500 early Thursday after having climbed a few pips above that level in the early American session on Wednesday. Buyers seem to have moved to the sidelines ahead of the highly-anticipated growth data from the US but the technical outlook suggests that the bullish bias stays intact in the near term.
The risk perception continued to drive the US Dollar's valuation mid-week. After the Nasdaq Composite Index opened with a gain of more than 1% on Wednesday, the US Dollar Index (DXY) fell sharply and allowed GBP/USD to test 1.2500. As the Dow Jones Industrial Average and the S&P 500 failed to hold in positive territory later in the session, however, the DXY managed to erase a portion of its daily losses.
US stock index futures are up between 0.3% and 0.8% in the European trading hours, pointing to another positive opening in Wall Street. Nevertheless, the US Bureau of Economic Analysis' first estimate of the first-quarter real Gross Domestic Product (GDP) growth could impact GBP/USD action in the early American session.
The US economy is forecast to show an annualized expansion of 2% in Q1. Markets could start pricing in more than one 25 basis points Federal Reserve (Fed) rate cuts later in the year if the data reveals a more severe slowdown in activity than expected. In that scenario, the USD is likely to continue to weaken against its major rivals.
On the other hand, an upbeat GDP print, at around 2.5%, could trigger a rebound in the DXY and force GBP/USD to turn south. If US stocks cheer that result, however, the pair's losses could remain limited.
GBP/USD Technical Analysis
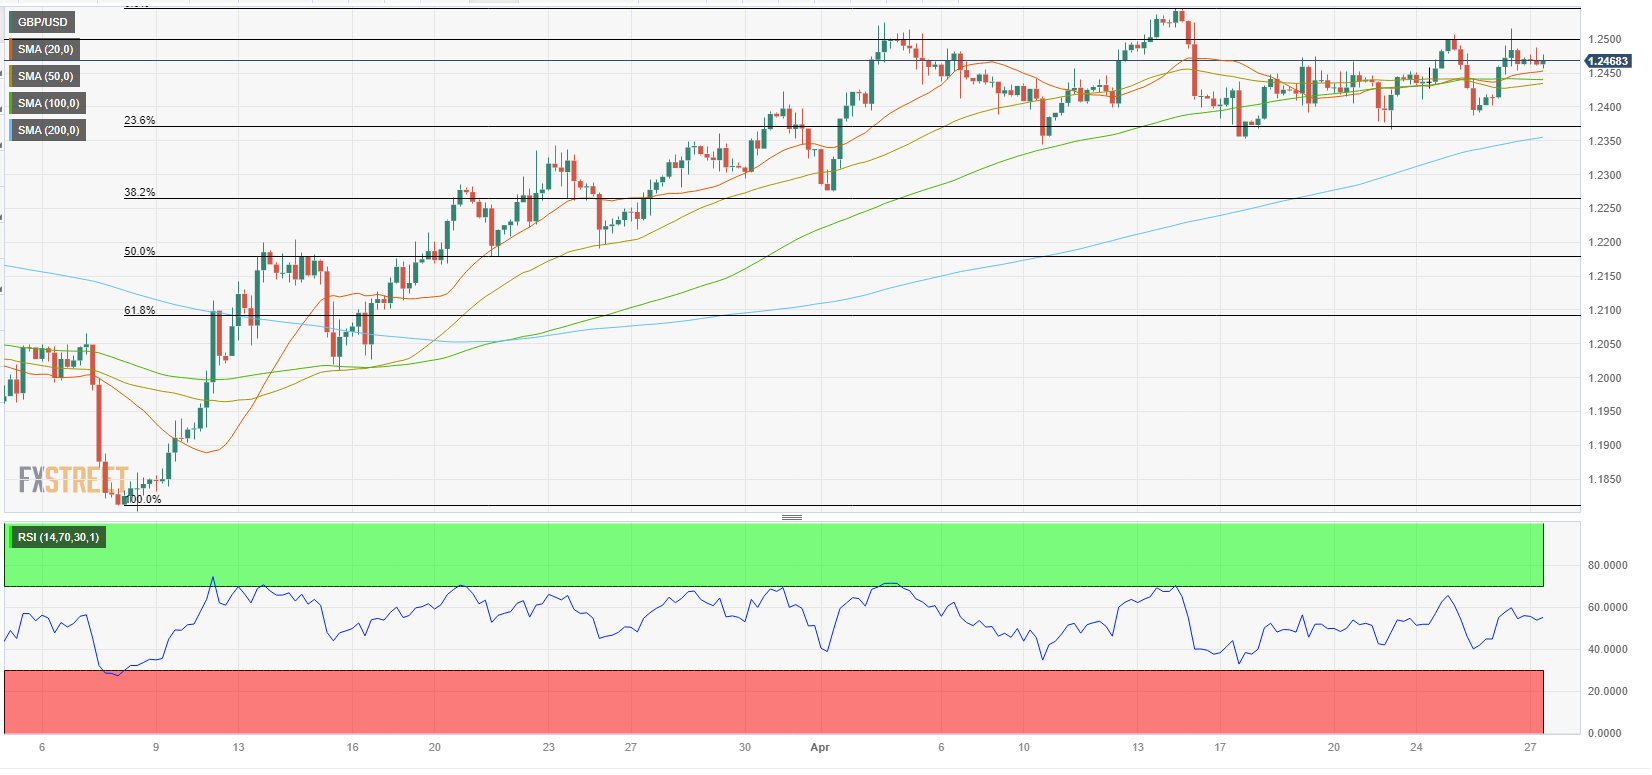
GBP/USD trades above the 1.2440/1.2450 support area, where the 20-period, 50-period and 100-period Simple Moving Averages on the four-hour chart are located. Additionally, the Relative Strength Index (RSI) indicator stays above 50 despite the latest pullback, confirming the bullish bias.
On the upside, 1.2500 (static level, psychological level) aligns as first resistance before 1.2550 (end-point of the uptrend) and 1.2600 (psychological level).
On the downside, a four-hour close below 1.2440/1.2450 area could open the door for an extended slide toward 1.2400 (psychological level, static level) and 1.2350 (200-period SMA).
Author

Eren Sengezer
FXStreet
As an economist at heart, Eren Sengezer specializes in the assessment of the short-term and long-term impacts of macroeconomic data, central bank policies and political developments on financial assets.


