|

GBP/USD flat correction can reach another blue box area [Video]

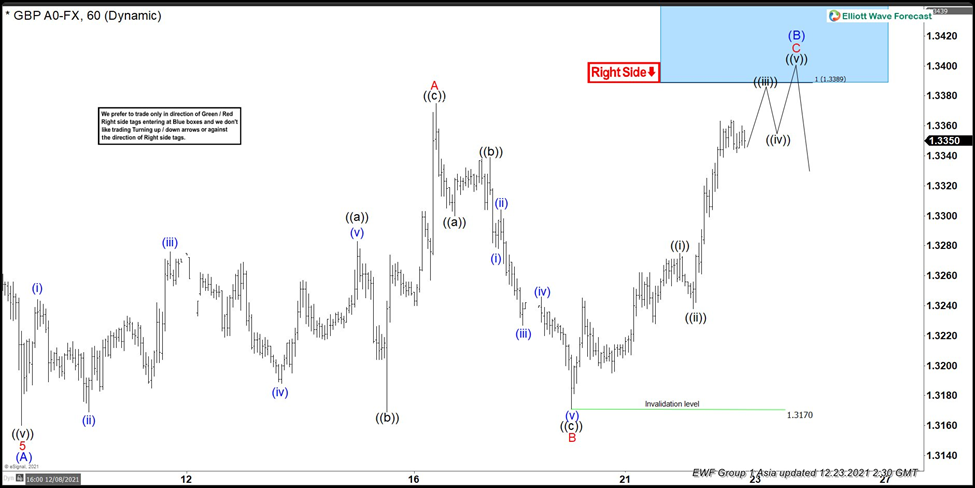
Short-term Elliott Wave view in GBPUSD suggests that a decline to $1.3160 low ended the cycle from October 20, 2021 peak in wave (A). Up from there, the pair is correcting that cycle in wave (B) bounce. The internals of that bounce is unfolding as Elliott wave flat correction with the sub-division of 3-3-5 structure before downtrend resume again. While the initial bounce in wave A unfolded as a lesser degree zigzag structure. Whereas the initial bounce to $1.3283 high ended wave ((a)). Wave ((b)) ended at $1.3169 low and wave ((c)) ended at $1.3375 high.

Down from there, the pair declined in another 3 swings within wave B where wave ((a)) ended at a $1.3300 low. Wave ((b)) ended at $1.3339 high and wave ((c)) ended at $1.3170 low. Since then, the pair has started the C leg in an impulse sequence. Near-term, as far as dips remain above $1.3170 low the pair is expected to reach $1.3389- $1.3513 blue box area. From there, the next leg lower is expected to take place looking for more downside ideally. Or the pair should fail lower for a 3 wave pullback at least.

GBP/USD 1 hour Elliott Wave chart

Chart

GBP/USD Elliott Wave video

Author

Elliott Wave Forecast Team

Elliott Wave Forecast Team

ElliottWave-Forecast.com

More from Elliott Wave Forecast Team
Share:

Editor's Picks

AUD/USD stays bid above 0.7100 on Australian trade data, Mideast optimism

AUD/USD clings to minor recovery gains above 0.7100 in the Asian session on Thursday as a new Israel-Lebanon ceasefire keeps a lid on the safe-haven US Dollar. Meanwhile, strong AustralianTrade Balane data also help the Aussie pair sustain the bounce from weekly lows.

USD/JPY hovers near the 160.00 intervention threshold on Mideast tensions

USD/JPY struggles to find acceptance above 160.00 and retreats from a one-month high in the Asian session on Thursday amid fears that authorities will step in again to prop up the Japanese Yen. Furthermore, a new Israel-Lebanon ceasefire caps the US Dollar and supports the currency pair. However, renewed US-Iran tensions keep the downside limited in the Greenback and the pair.

Gold defends 200-day SMA; upside seems capped on Iran uncertainty

Gold recovers from a one-week low near $4,425, or the 200-day SMA, in the Asian session on Thursday, as news of an Israel-Lebanon ceasefire acts as a headwind for the safe-haven US Dollar. However, renewed hostilities in the Gulf, along with stalled US-Iran peace talks, keep geopolitical risks in play and should support the USD, checking the Gold price rebound.


Bitcoin drops below $65K amid reinforced bear market signals

Bitcoin dipped further below $65,000 on Wednesday, with onchain data from Glassnode signaling a market firmly in a bear phase. The decline has pushed prices back into a key valuation range between the Realized Price and the True Market Mean. Glassnode noted that a key shift in market structure has also emerged.

Kevin Warsh takes the Fed helm: What it means for the US Dollar
The Federal Reserve moves away from the highly predictable "forward guidance" model of the Jerome Powell era to a new “Kevin Warsh environment”, characterized by less communication, more policy surprises, and an increased focus on the Fed's complex balance sheet.
Recession on paper: What really moves the Canadian Loonie now?

Statistics Canada handed the headline writers a gift and the analysts a headache. Real GDP shrank 0.1% on an annualized basis in the first quarter, and with the fourth quarter of 2025 revised down to a 1.0% contraction, that is two negative quarters in a row, the textbook definition of a technical recession and Canada's first since the pandemic.