GBP/USD Elliott Wave technical analysis [Video]
![GBP/USD Elliott Wave technical analysis [Video]](https://editorial.fxsstatic.com/images/i/GBPUSD-neutral-object-1.png)
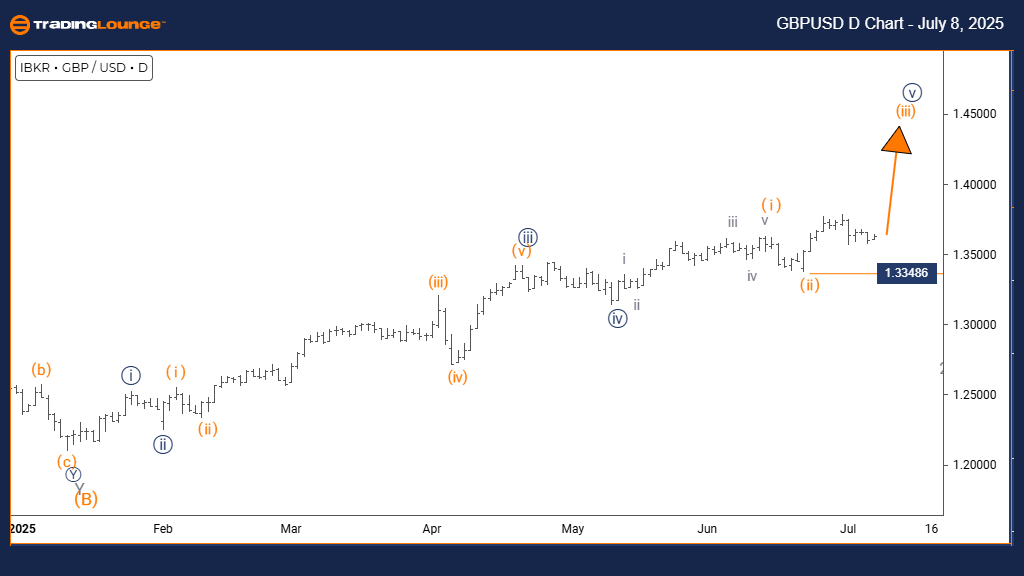
GBP/USD Elliott Wave technical analysis
Function: Bullish Trend.
Mode: Impulsive.
Structure: Orange Wave 3.
Position: Navy Blue Wave 5.
Direction (Next lower degree): Orange Wave 4.
Details:
Orange wave 2 appears to be completed, and orange wave 3 is currently in motion.
Wave cancellation (Invalidation) level: 1.33486.
The GBPUSD daily chart indicates a bullish trend based on Elliott Wave principles. Price action is impulsive, forming orange wave 3 within the broader navy blue wave 5. This structure points to continued upward movement, though a correction in orange wave 4 is expected next.
With orange wave 2 behind us, the pair is progressing through orange wave 3, showing strong bullish momentum. The structure’s impulsive nature indicates solid directional movement. The invalidation level is set at 1.33486 — a drop below this would invalidate the current wave count and imply a shift in market trend.
The position within navy blue wave 5 suggests that the uptrend may be nearing its peak, but more gains are still possible. Traders can maintain a bullish stance while monitoring for signs of wave 3 completion, which would likely precede the orange wave 4 correction.
This analysis offers a structured approach to interpreting GBPUSD price action and identifying critical support and reversal zones.
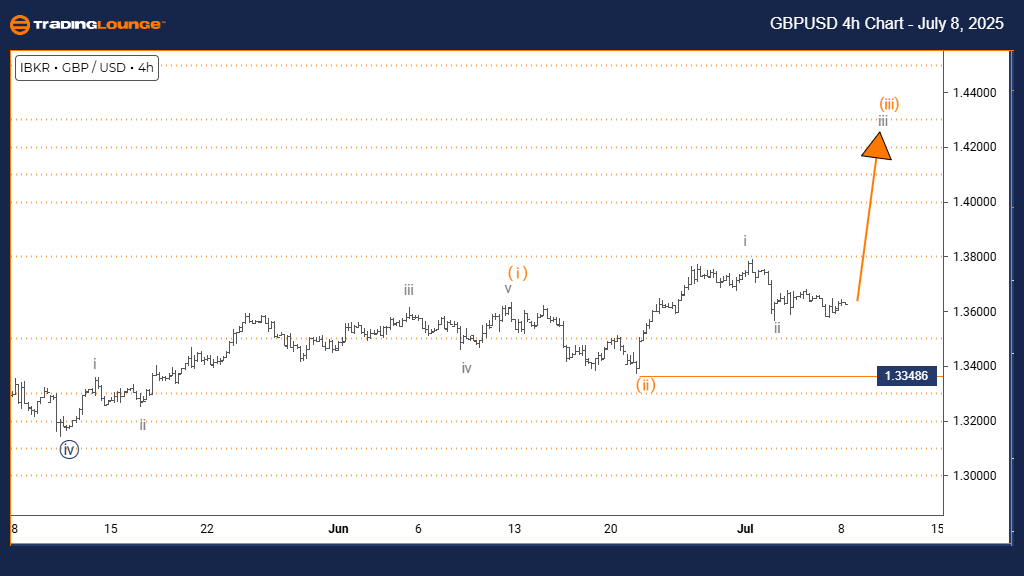
GBP/USD Elliott Wave technical analysis
Function: Bullish Trend.
Mode: Impulsive.
Structure: Gray Wave 3.
Position: Orange Wave 3.
Direction (Next higher degree): Gray Wave 3.
Details:
Gray wave 2 appears completed, and gray wave 3 is in progress.
Wave Cancellation (Invalidation) Level: 1.33486
On the 4-hour chart, GBPUSD maintains a bullish trend in an impulsive formation. The ongoing structure places the pair in gray wave 3, within the context of orange wave 3. This indicates strong buying pressure and supports a positive short-term outlook.
With gray wave 2 likely concluded, the current progression through gray wave 3 suggests potential for further upside. The structure’s impulsive pattern signals robust momentum. An invalidation level is set at 1.33486 — if the price drops below, the bullish outlook would need reassessment.
This analysis signals an opportunity for traders to engage in the trend as long as price action remains above the invalidation level. The next major event is a likely corrective gray wave 4 following the current impulsive phase.
Overall, GBPUSD shows continued bullish strength with room for additional gains. The analysis supports maintaining long positions while monitoring wave progress and key levels.
GBP/USD Elliott Wave technical analysis [Video]
Author

Peter Mathers
TradingLounge
Peter Mathers started actively trading in 1982. He began his career at Hoei and Shoin, a Japanese futures trading company.


