GBP/USD Elliott Wave technical analysis [Video]
![GBP/USD Elliott Wave technical analysis [Video]](https://editorial.fxsstatic.com/images/i/GBPUSD-neutral-object-1.png)
GBP/USD Elliott Wave technical analysis
-
Function: Bullish Trend.
-
Mode: Impulsive.
-
Structure: Orange Wave 3.
-
Position: Navy Blue Wave.
-
Direction next lower degrees: Orange Wave 4.
-
Details: Orange Wave 2 of 3 appears to be completed; now, Orange Wave 3 is in progress.
-
Wave cancellation invalidation level: 1.20966.
Analysis overview
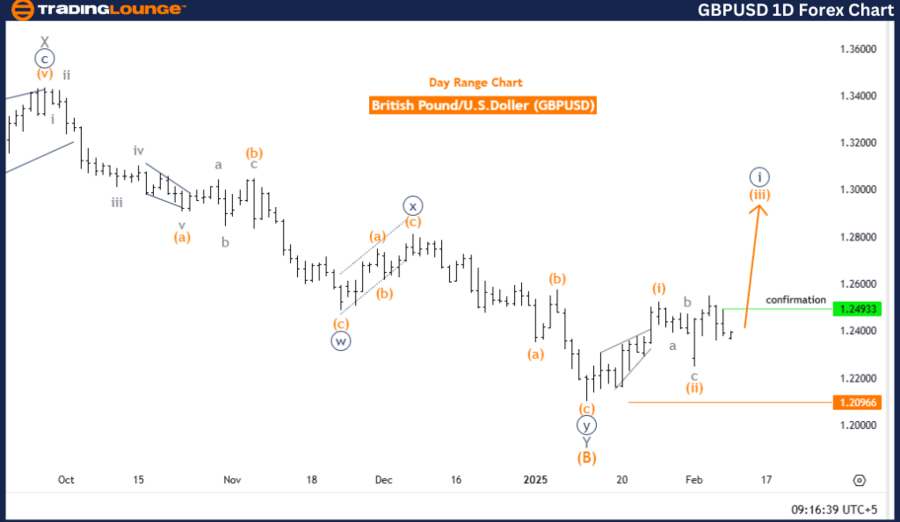
The GBPUSD Elliott Wave Analysis for the daily chart evaluates the British Pound against the U.S. Dollar, highlighting a bullish trend. The market mode is identified as impulsive, indicating strong momentum in the current trend direction.
The structure is classified as Orange Wave 3, forming part of a broader wave cycle within the Navy Blue Wave. This phase suggests that the market is experiencing significant upward movement.
Wave progression and key levels
The analysis suggests that Orange Wave 2, which served as a corrective phase within the larger wave structure, has likely completed. This signals the start of Orange Wave 3, expected to push the price higher.
Looking ahead, the next lower degree movement is identified as Orange Wave 4. This means that once Orange Wave 3 concludes, a corrective phase (Orange Wave 4) may follow.
A crucial level to monitor is the Wave Cancellation Invalidation Level at 1.20966. If the price falls below this threshold, the current wave count would be invalidated, potentially shifting the bullish outlook. Traders should watch this level closely to confirm trend continuation.
Summary
The GBPUSD Daily Chart Analysis indicates a bullish trend with impulsive momentum, currently in Orange Wave 3 within the larger Navy Blue Wave structure. The completion of Orange Wave 2 has paved the way for further upside movement.
The 1.20966 level acts as a critical invalidation point, defining whether the bullish trend remains intact. If Orange Wave 3 unfolds as anticipated, Orange Wave 4 (a corrective phase) will likely follow.
This analysis offers traders a clear framework to understand market dynamics and potential price movements.
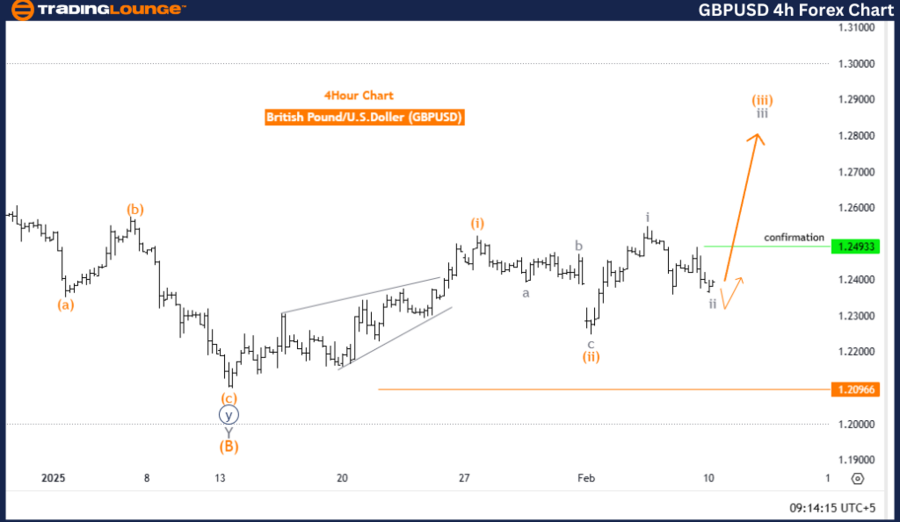
British Pound/ U.S. Dollar (GBP/USD) - Four-hour chart.
GBP/USD Elliott Wave technical analysis
-
Function: Bullish Trend.
-
Mode: Impulsive.
-
Structure: Gray Wave 3.
-
Position: Orange Wave 3.
-
Direction next higher degrees: Gray Wave 3 (Started).
-
Details: Gray Wave 2 of Orange Wave 3 appears completed; now, Gray Wave 3 is in progress.
-
Wave cancellation invalidation level: 1.20966.
Analysis overview
The GBPUSD Elliott Wave Analysis for the 4-hour chart examines the British Pound against the U.S. Dollar, indicating a bullish trend. The market is classified as impulsive, suggesting strong momentum in the current direction.
The structure is described as Gray Wave 3, which is part of a larger wave formation known as Orange Wave 3. This suggests that the market is experiencing a significant upward movement.
Wave progression and key levels
The analysis indicates that Gray Wave 2, which served as a corrective phase within Orange Wave 3, has likely completed. This completion signals the start of Gray Wave 3, which is expected to push the price further upward.
The next higher degree movement is confirmed as Gray Wave 3, reinforcing the bullish momentum in the near term.
A crucial level to monitor is the Wave Cancellation Invalidation Level at 1.20966. If the price drops below this threshold, the current wave count would be invalidated, potentially shifting the bullish outlook. Traders should keep a close watch on this level to confirm trend continuation.
Summary
The GBPUSD 4-Hour Chart Analysis suggests a bullish trend with strong impulsive momentum, currently in Gray Wave 3 of Orange Wave 3. The completion of Gray Wave 2 has set the stage for further upside movement.
The 1.20966 level serves as a critical invalidation point, determining whether the bullish trend remains valid. If Gray Wave 3 unfolds as expected, the price is likely to continue rising, reinforcing bullish sentiment in the market.
This analysis provides traders with a clear framework to understand market dynamics and future price movements.
GBP/USD Elliott Wave technical analysis [Video]
Author

Peter Mathers
TradingLounge
Peter Mathers started actively trading in 1982. He began his career at Hoei and Shoin, a Japanese futures trading company.


