GBP/USD Elliott Wave technical analysis [Video]
![GBP/USD Elliott Wave technical analysis [Video]](https://editorial.fxsstatic.com/images/i/GBPUSD-bearish-line_XtraLarge.png)
GBP/USD Elliott Wave technical analysis
-
Function: Trend.
-
Mode: Impulsive.
-
Structure: Orange Wave 3.
-
Position: Navy Blue Wave 1.
-
Direction next lower degrees: Orange Wave 4.
Details:
-
Orange Wave 2 of Navy Blue Wave 1 appears to be completed, with Orange Wave 3 now in progress.
-
Wave Cancel Invalidation Level: 1.22425.
The daily chart analysis of the British Pound against the US Dollar (GBPUSD) applies Elliott Wave Theory, indicating an ongoing bullish trend with an impulsive structure. The primary focus is on Orange Wave 3, which has begun following the completion of Orange Wave 2 within Navy Blue Wave 1. This suggests a continuation of upward market momentum.
Currently, the price is positioned in Navy Blue Wave 1, representing the early phase of a potential extended bullish sequence. The completion of Orange Wave 2 indicates a transition toward a stronger upward push, with Orange Wave 3 actively developing. This wave is typically the most powerful in an impulsive structure, reinforcing the bullish sentiment.
Looking forward, the analysis highlights Orange Wave 4 as the next anticipated corrective phase once Orange Wave 3 completes. However, for now, the market focus remains on the bullish trajectory driven by Orange Wave 3.
The wave cancel invalidation level is set at 1.22425. A break below this level would invalidate the current wave count and require a reassessment of the market outlook.
Conclusion
The daily chart analysis for GBPUSD indicates a bullish phase, with Orange Wave 3 actively progressing within Navy Blue Wave 1. The completion of Orange Wave 2 confirms the start of an impulsive upward wave, expected to bring strong bullish momentum.
Traders should closely monitor key market movements, especially the invalidation level, to validate or adjust trading strategies. This analysis provides essential insights for navigating the ongoing bullish trend and preparing for potential corrections or future advancements.
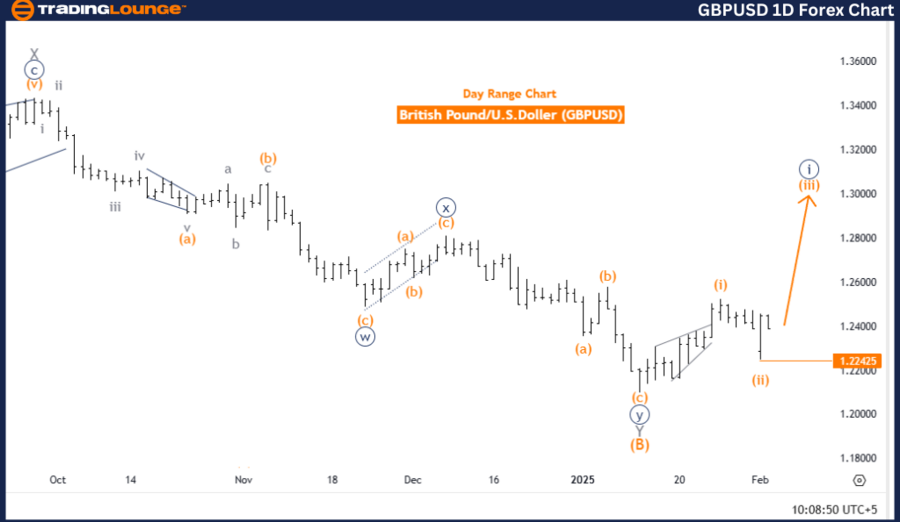
GBP/USD – Day chart
GBP/USD Elliott Wave Technical Analysis
-
Function: Bullish Trend.
-
Mode: Impulsive.
-
Structure: Orange Wave 3.
-
Position: Navy Blue Wave 1.
-
Direction next higher degrees: Orange Wave 3 (Started).
Details:
-
Orange Wave 2 of Navy Blue Wave 1 appears to be completed, with Orange Wave 3 now in play.
-
Wave cancel invalidation level: 1.22425.
The four-hour chart analysis of GBPUSD applies Elliott Wave Theory, indicating an ongoing bullish trend with an impulsive structure. The primary focus is on Orange Wave 3, which has commenced after the completion of Orange Wave 2 within Navy Blue Wave 1. This suggests continued upward market momentum.
At present, the market is positioned in Navy Blue Wave 1, marking the early stage of a potentially broader bullish phase. The successful completion of Orange Wave 2 confirms that the market is primed for further upside movement into Orange Wave 3, which typically signals strong bullish momentum in an impulsive sequence.
The wave cancel invalidation level is set at 1.22425. A price drop below this level would invalidate the current wave count, requiring a reassessment of the market structure.
Summary
The four-hour chart analysis for GBPUSD points to the development of a bullish trend, driven by the emergence of Orange Wave 3 within Navy Blue Wave 1. The completion of Orange Wave 2 indicates a shift toward stronger upward momentum, aligning with the impulsive phase of the Elliott Wave pattern.
Traders should closely observe key price movements and use the wave cancel invalidation level as a reference point for validating or adjusting trading strategies. This analysis provides valuable insights for navigating the ongoing bullish phase and preparing for potential future price increases.
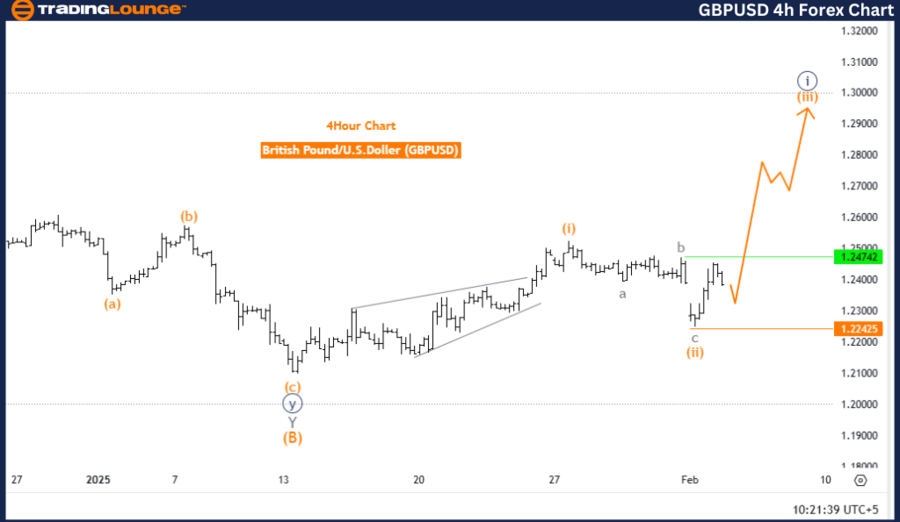
GBP/USD – Four-hour chart
GBP/USD Elliott Wave technical analysis [Video]
Author

Peter Mathers
TradingLounge
Peter Mathers started actively trading in 1982. He began his career at Hoei and Shoin, a Japanese futures trading company.


