GBP/USD Elliott Wave technical analysis [Video]
![GBP/USD Elliott Wave technical analysis [Video]](https://editorial.fxstreet.com/images/Markets/Currencies/Majors/GBPUSD/strong-pound-weak-dollar-17536259_XtraLarge.jpg)
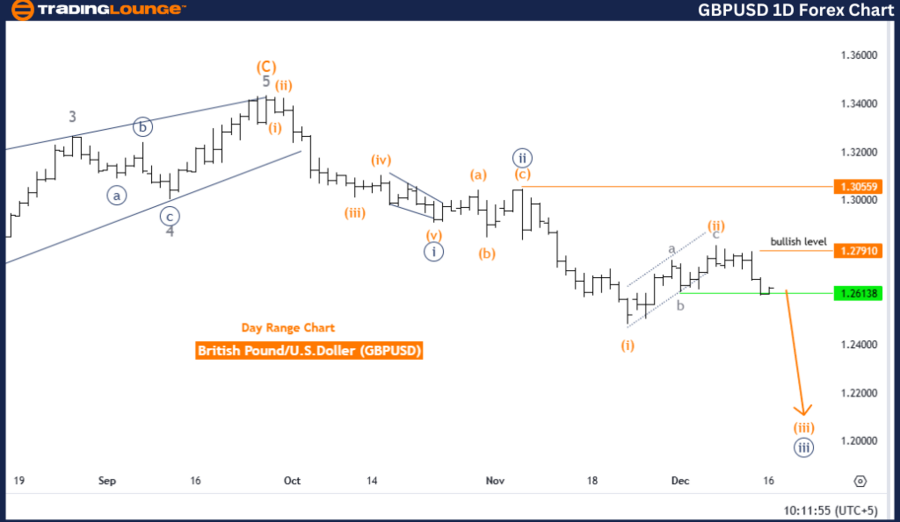
GBPUSD Elliott Wave Analysis - Trading Lounge.
British Pound/ U.S. Dollar (GBPUSD) Day Chart.
GBP/USD Elliott Wave technical analysis
-
Function: Bearish Trend.
-
Mode: Impulsive.
-
Structure: Orange Wave 3.
-
Position: Navy Blue Wave 3.
-
Direction next higher degrees: Orange Wave 4.
-
Details: Orange Wave 2 appears completed; currently, Orange Wave 3 of Navy Blue Wave 3 is in progress.
-
Wave cancel invalidation level: 1.27910
Analysis overview
The GBPUSD daily chart indicates a dominant bearish trend based on Elliott Wave analysis. The wave mode is impulsive, reflecting strong downward momentum in the market. The ongoing wave structure is Orange Wave 3, currently unfolding within Navy Blue Wave 3. This scenario supports a continued bearish outlook, with expectations of further price declines.
The analysis suggests that Orange Wave 2 has been completed, initiating the development of Orange Wave 3 within Navy Blue Wave 3. This phase typically features notable selling pressure and rapid price movements, reinforcing the strong bearish momentum.
Higher-degree structure and next steps
Upon the completion of Orange Wave 3, the market is expected to transition into Orange Wave 4 as part of the larger wave cycle. However, the immediate focus remains on the ongoing progression of Orange Wave 3 within Navy Blue Wave 3, which is the primary driver of market direction at this stage.
Key levels to watch
A critical invalidation level has been identified at 1.27910. Any price movement above this level would invalidate the current wave count and necessitate a reassessment of the Elliott Wave structure. This level acts as a crucial reference point for both risk management and trend validation.
Conclusion
The GBPUSD daily chart reveals a strong bearish trend, with Orange Wave 3 actively directing the market lower. The completion of Orange Wave 2 and the development of Orange Wave 3 within Navy Blue Wave 3 confirm the ongoing downward momentum. Traders are advised to align with the bearish outlook while closely monitoring price action in relation to the invalidation level (1.27910) to effectively manage risk during this phase.
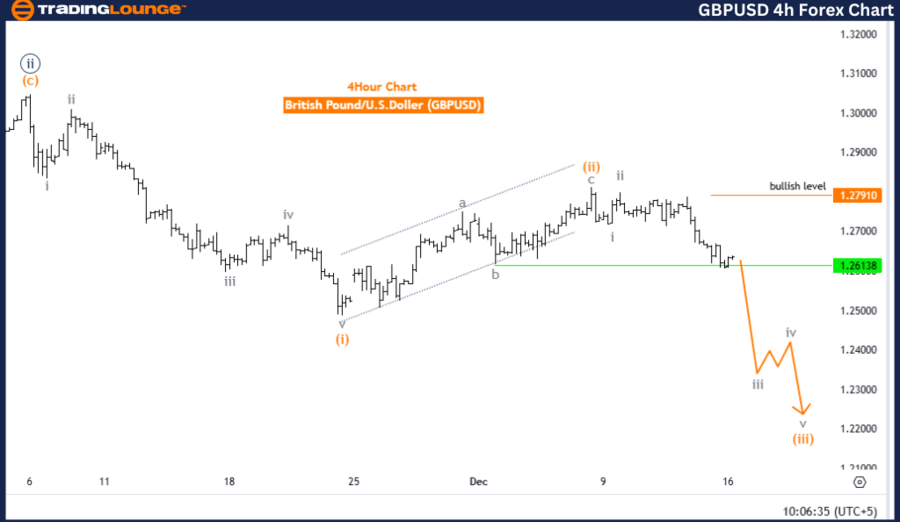
British Pound/ U.S. Dollar (GBPUSD) 4-Hour Chart.
GBP/USD Elliott Wave technical analysis
-
Function: Bearish Trend.
-
Mode: Impulsive.
-
Structure: Gray Wave 3.
-
Position: Orange Wave 3.
-
Direction next lower degrees: Gray Wave 3 (continuing).
-
Details: Gray Wave 2 appears completed; Gray Wave 3 is currently unfolding.
-
Wave cancel invalidation level: 1.27910.
Analysis overview
The GBPUSD four-hour chart highlights a bearish trend based on Elliott Wave analysis. The wave mode is impulsive, signifying strong downward momentum in the market. The ongoing wave structure, Gray Wave 3, is actively progressing, reinforcing the bearish sentiment.
The analysis indicates that Gray Wave 2 has completed, transitioning into Gray Wave 3, which typically represents the most significant price decline within the impulsive wave sequence. The market is presently positioned within Orange Wave 3, adding further weight to the bearish outlook.
Next phases and implications
The next anticipated phase is the continuation of Gray Wave 3, signaling further downward movement in line with the impulsive trend. This progression aligns with bearish market expectations, presenting opportunities for traders to consider short positions or other strategies designed to capitalize on a declining market.
Key levels to watch
The critical invalidation level for this wave structure is set at 1.27910. Any movement above this level would invalidate the current wave count, necessitating a reassessment of the Elliott Wave structure and overall market outlook. This invalidation level serves as an essential reference for risk management and trend validation.
Conclusion
The GBPUSD four-hour chart demonstrates a strong bearish trend, with Gray Wave 3 driving the current market direction. The completion of Gray Wave 2 and the active progression of Gray Wave 3 emphasize the sustained downward momentum. Traders should closely monitor price action, ensuring alignment with the Elliott Wave framework while remaining vigilant about the invalidation level (1.27910) to manage risks effectively during this bearish phase.
Technical analyst: Malik Awais.
GBP/USD Elliott Wave technical analysis [Video]
Author

Peter Mathers
TradingLounge
Peter Mathers started actively trading in 1982. He began his career at Hoei and Shoin, a Japanese futures trading company.


