GBP/USD Elliott Wave technical analysis [Video]
![GBP/USD Elliott Wave technical analysis [Video]](https://editorial.fxstreet.com/images/Markets/Currencies/Majors/GBPUSD/new-twenty-pound-notes-3079030.jpg)
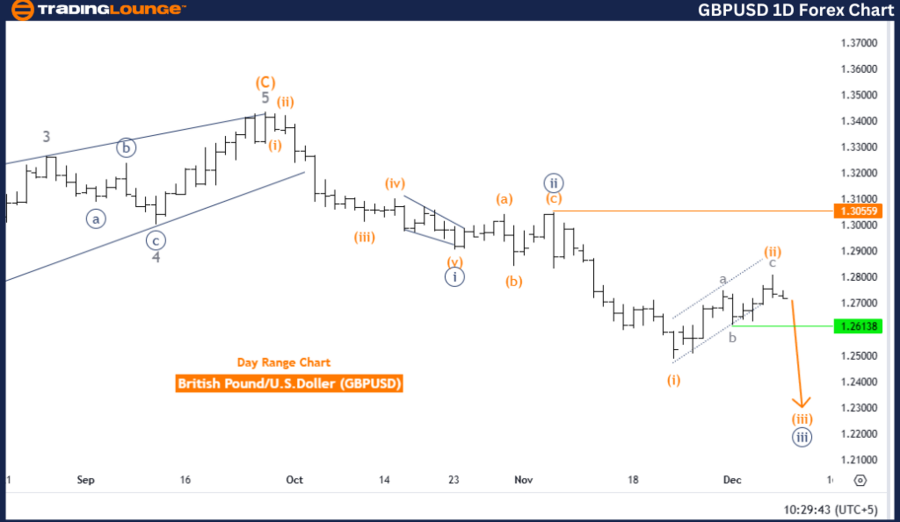
GBPUSD Elliott Wave Analysis Trading Lounge Day Chart.
British Pound/ U.S. Dollar (GBPUSD) – Day Chart.
GBP/USD Elliott Wave technical analysis
Function: Bearish Trend.
Mode: Impulsive.
Structure: Orange Wave 3.
Position: Navy Blue Wave 3.
Direction of next lower degrees: Orange Wave 3 (in progress).
Details
-
The daily chart of GBPUSD demonstrates a bearish trend based on Elliott Wave analysis.
-
The current wave structure is identified as orange wave 3, which forms part of the impulsive sequence within navy blue wave 3.
-
This indicates ongoing downward pressure in the market.
The analysis suggests that orange wave 2 appears to have completed, paving the way for the development of orange wave 3 within navy blue wave 3. Consistent with Elliott Wave Theory, impulsive waves signify strong directional moves, and the active orange wave 3 signals a notable bearish phase with further potential for price declines.
Key technical level
-
Wave Cancellation/Invalidation Level: 1.30502. If the market rises above this level, the current wave structure will need reassessment, potentially indicating a deviation from the projected bearish trend.
This Elliott Wave analysis provides a structured approach for traders to interpret GBPUSD’s bearish momentum. By emphasizing critical levels and directional trends, the analysis supports an understanding of the ongoing downward trajectory as the impulsive wave unfolds.
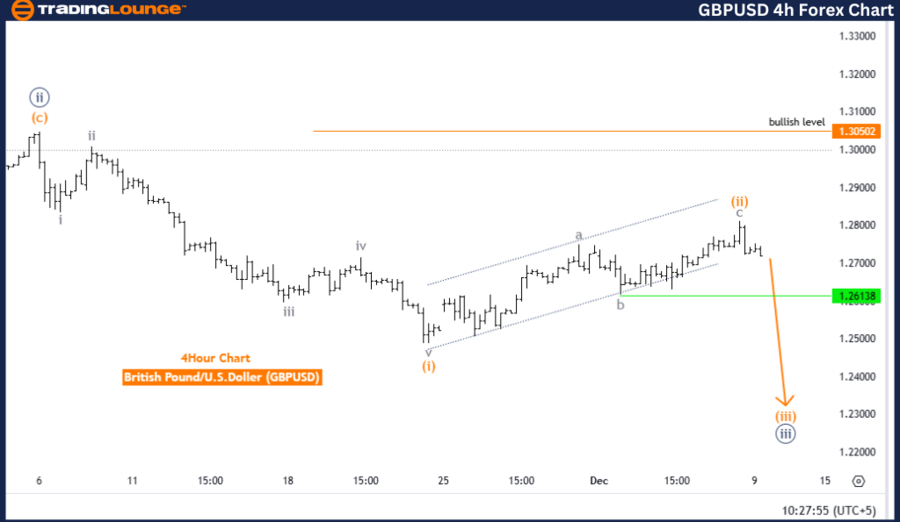
British Pound/ U.S. Dollar (GBPUSD) – 4-Hour Chart.
GBP/USD Elliott Wave technical analysis
Function: Bearish Trend.
Mode: Impulsive.
Structure: Orange Wave 3.
Position: Navy Blue Wave 3.
Direction of next lower degrees: Orange Wave 3 (in progress).
Details
-
The GBPUSD 4-hour chart presents an Elliott Wave analysis indicating a bearish trend.
-
The current wave structure is identified as orange wave 3, which is part of an impulsive sequence within navy blue wave 3.
-
This highlights the continuation of downward momentum in the market.
The analysis suggests that orange wave 2 has likely completed, marking the onset of orange wave 3 within navy blue wave 3. In line with Elliott Wave Theory, impulsive waves are characterized by strong directional movements. The active orange wave 3 indicates a significant bearish phase, with the potential for further price declines.
Key technical level
-
Wave Cancellation/Invalidation Level: 1.30502. If the market moves above this level, the current wave structure must be reevaluated, indicating a possible departure from the expected bearish trend.
This Elliott Wave analysis delivers a structured framework for traders to assess the GBPUSD’s bearish trajectory. By emphasizing critical levels and trends, it provides valuable insights into the continuation of downward momentum as the impulsive wave sequence evolves.
Technical analyst: Malik Awais.
GBP/USD Elliott Wave technical analysis [Video]
Author

Peter Mathers
TradingLounge
Peter Mathers started actively trading in 1982. He began his career at Hoei and Shoin, a Japanese futures trading company.


