GBP/USD Elliott Wave technical analysis [Video]
![GBP/USD Elliott Wave technical analysis [Video]](https://editorial.fxstreet.com/images/Markets/Currencies/Majors/GBPUSD/iStock-472155766.jpg)
GBP/USD Elliott Wave technical analysis
-
Function: Bearish Trend.
-
Mode: Impulsive.
-
Structure: Navy blue wave 1.
-
Position: Gray wave 1.
-
Direction next higher degrees: Navy blue wave 2.
-
Details: Navy blue wave 1 remains active.
-
Wave cancel invalid level: 1.34351
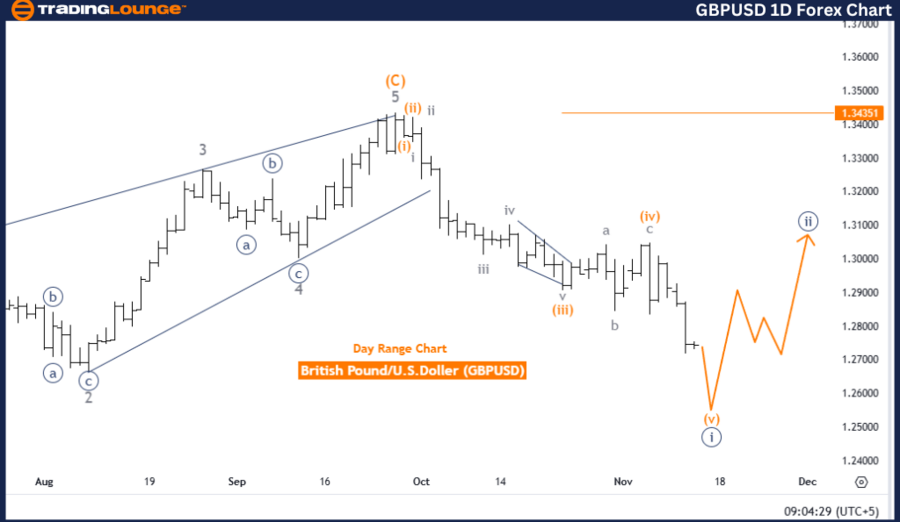
The Elliott Wave analysis for the GBPUSD daily chart from Trading Lounge highlights a bearish trend in the currency pair, driven by an impulsive wave structure. The current analysis identifies navy blue wave 1 as ongoing, signaling a continuation of the downward momentum within the broader bearish framework.
Currently positioned in gray wave 1, this impulsive movement suggests further price declines as the wave structure develops. The unfolding of navy blue wave 1 underscores the likelihood of sustained bearish pressure on GBPUSD, consistent with the broader trend direction.
The impulsive nature of the wave structure indicates strong, directional moves, supporting expectations for additional downside. An invalidation level is set at 1.34351, representing a crucial point in the analysis. A price movement to or above this level would invalidate the current wave structure, signaling a potential reversal or the start of a corrective phase. Such an event would prompt a re-evaluation of the Elliott Wave analysis.
Summary
This analysis reinforces a bearish perspective for GBPUSD as navy blue wave 1 progresses within the impulsive structure of gray wave 1. Traders should closely monitor price action near the invalidation level of 1.34351. A break above this threshold may indicate a reversal or necessitate a reassessment of the wave structure, deviating from the current bearish trend outlook.
GBP/USD Elliott Wave technical analysis
-
Function: Bearish Trend.
-
Mode: Impulsive.
-
Structure: Orange wave 5.
-
Position: Navy blue wave 1.
-
Direction next higher degrees: Navy blue wave 2.
-
Details: Orange wave 4 appears completed. Orange wave 5 of navy blue wave 1 is active.
-
Wave cancel invalid level: 1.30099.
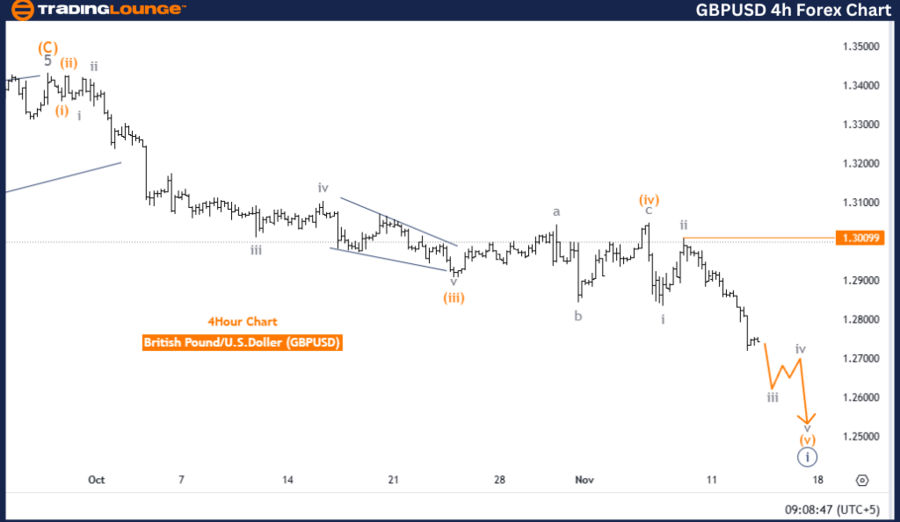
The GBPUSD Elliott Wave analysis for the 4-hour chart from Trading Lounge identifies a bearish trend in the currency pair, marked by an impulsive wave pattern. Orange wave 5 is currently unfolding as part of the larger navy blue wave 1, signaling continued downward movement.
Following the apparent completion of orange wave 4, orange wave 5 has commenced within the impulsive framework of navy blue wave 1. Typically, wave 5 represents the final phase of an impulsive trend, reinforcing the bearish momentum and increasing the probability of further downside in GBPUSD.
The analysis highlights a critical invalidation level at 1.30099. If the price moves to or above this point, the current wave structure would be invalidated, indicating a potential trend reversal or the start of a corrective phase. This invalidation level is a vital reference for confirming the bearish trend. A breach of this level could challenge the current analysis, necessitating a reassessment of the wave structure.
Summary
This analysis supports a bearish outlook for GBPUSD, driven by orange wave 5 within navy blue wave 1. Traders should closely monitor price movements near the invalidation level at 1.30099. Any rise above this threshold may suggest a reversal or a shift in the wave structure, impacting the overall bearish trend projection.
GBP/USD Elliott Wave technical analysis [Video]
Author

Peter Mathers
TradingLounge
Peter Mathers started actively trading in 1982. He began his career at Hoei and Shoin, a Japanese futures trading company.


