GBP/USD Elliott Wave technical analysis [Video]
![GBP/USD Elliott Wave technical analysis [Video]](https://editorial.fxstreet.com/images/Markets/Currencies/Majors/GBPUSD/british-banknotes-14144912.jpg)
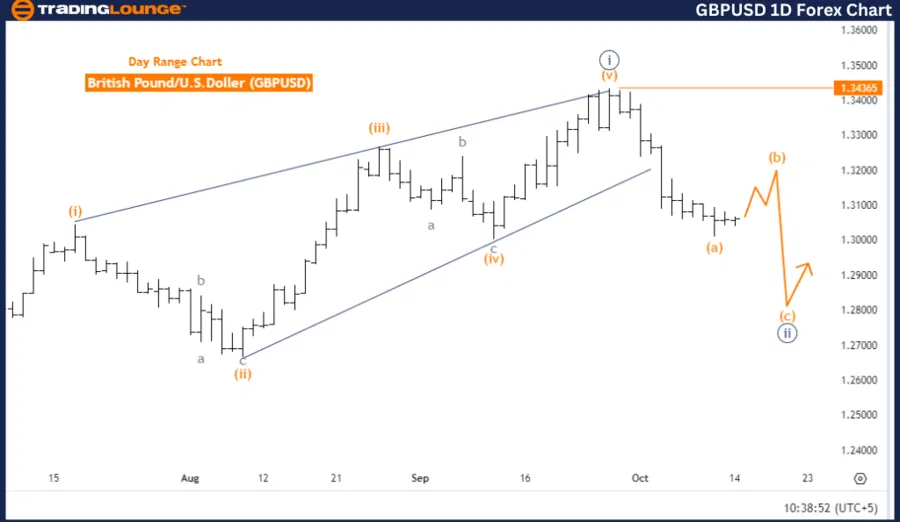
British Pound/ U.S. Dollar (GBP/USD) day chart.
GBP/USD Elliott Wave technical analysis
-
Function: Counter Trend.
-
Mode: Corrective.
-
Structure: Navy Blue Wave 2.
-
Position: Gray Wave 3.
-
Direction (next higher degrees): Navy Blue Wave 3.
-
Details: Navy Blue Wave 1 completed, Navy Blue Wave 2 in play.
-
Wave cancel invalid level: 1.34365.
Analysis overview
The GBPUSD Elliott Wave analysis on the daily chart indicates that the pair is currently in a counter-trend corrective phase, with navy blue wave 2 in progress. This phase follows the completion of navy blue wave 1, marking a temporary retracement before the broader trend resumes.
Wave structure and position
The current wave structure suggests that gray wave 3 forms part of the broader corrective pattern. Once navy blue wave 2 completes, the next move is expected to lead the market into navy blue wave 3, signaling a continuation of the upward trend.
Key details
-
Navy blue wave 1 has already finished, and the market is now unfolding navy blue wave 2. This corrective phase will remain active until the market transitions into the next impulsive move, navy blue wave 3.
-
Wave Cancel Invalid Level: If GBPUSD rises above 1.34365, the current wave structure would be invalidated, and a new wave analysis would be required.
Summary
In conclusion, GBPUSD is currently in a corrective phase (navy blue wave 2) following the completion of navy blue wave 1. Once this correction concludes, the pair is expected to resume its upward trend with the development of navy blue wave 3. The analysis remains valid as long as the price stays below 1.34365.
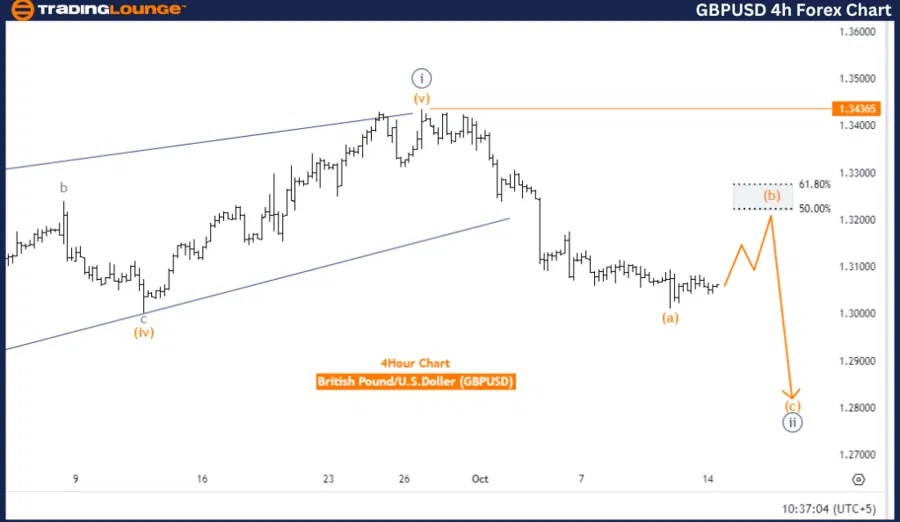
British Pound/ U.S. Dollar (GBPUSD) four-hour chart.
GBP/USD Elliott Wave technical analysis
- Function: Counter Trend
- Mode: Corrective
- Structure: Orange Wave B
- Position: Navy Blue Wave 2
- Direction (Next Lower Degrees): Orange Wave C
- Details: Orange Wave A of 2 completed, Orange Wave B of 2 in progress
- Wave Cancel Invalid Level: 1.34365
Analysis overview
The GBPUSD Elliott Wave analysis on the 4-hour chart shows that the pair is in a corrective counter-trend phase, with the structure currently forming orange wave B, following the completion of orange wave A. The market remains positioned within navy blue wave 2, indicating that this correction is part of the broader structure.
Wave structure and position
After orange wave B completes, the next expected movement is the development of orange wave C. This next corrective phase will follow orange wave B, continuing the overall structure of the correction within navy blue wave 2.
Key details
- Orange wave A of wave 2 has completed, and orange wave B of wave 2 is currently unfolding. This corrective sequence suggests that the pair is undergoing a temporary retracement within the larger trend.
- Wave Cancel Invalid Level: If GBPUSD rises above 1.34365, the current wave count will no longer be valid, indicating that the market structure needs reassessment.
Summary
In summary, GBPUSD is in the middle of a corrective phase within orange wave B, part of navy blue wave 2. After orange wave B completes, the pair is expected to move into orange wave C as the correction continues. The analysis remains valid as long as the pair stays below 1.34365.
GBP/USD Elliott Wave technical analysis [Video]
Author

Peter Mathers
TradingLounge
Peter Mathers started actively trading in 1982. He began his career at Hoei and Shoin, a Japanese futures trading company.


