GBP/USD Elliott Wave: Medium-term top

Executive summary
- GBPUSD appears to be progressing lower in the final leg of wave 2.
- Downside targets include 1.31 and possibly 1.28.
- If Wednesday’s high of 1.3726 is broken, then we’ll reconsider the wave count.
GBP/USD Elliott Wave count
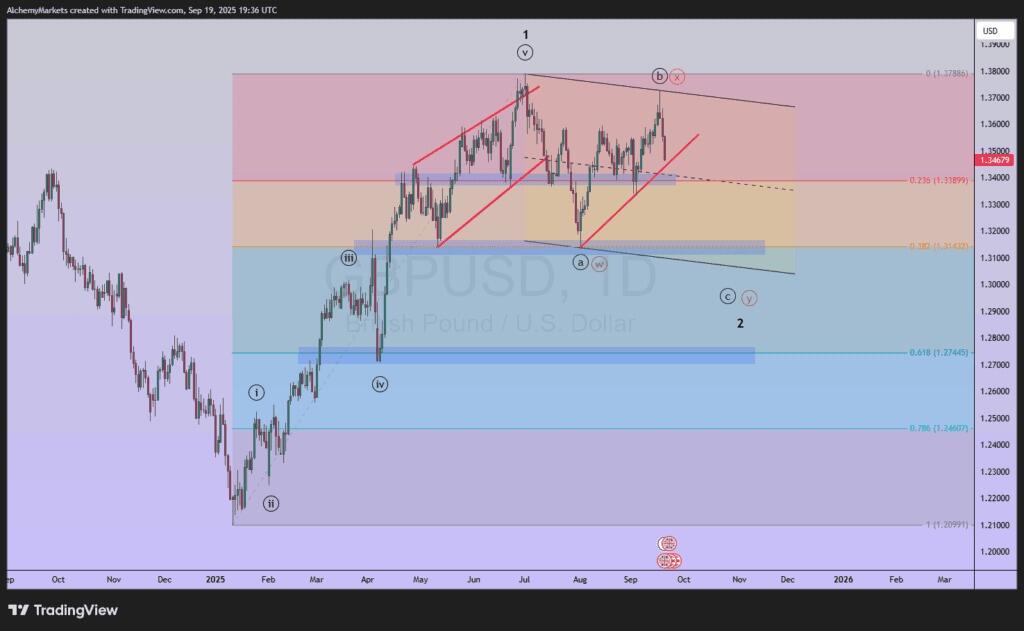
It appears that Cable completed wave ((b)) or ((x)) of wave 2 at Wednesday’s high of 1.3726. This means a multi-hundred pip decline is underway in wave ((c)) or ((y)) of 2. This decline likely carries down to 1.31 and possibly 1.28.
If the decline unfolds in 5-waves, then we’ll consider it to be wave ((c)), a five-wave Elliott wave pattern. If the decline unfolds in 3-waves, then we’ll consider it to be wave ((y)), a double zigzag pattern.
GBP/USD is approaching an upward sloping support trend line that has been in place since August. If this trend line breaks, then it opens the door to 1.31 and possibly lower levels.
Part of the reason to consider 1.31 a target zone is that the previous decline on August 4 reached a low of 1.3141. On May 12, GBPUSD reached a low of 1.3139. Then, on April 3, GBPUSD spiked higher and left a long topside wick piercing this same 1.3140 price zone. Additionally, there is a 38% Fibonacci retracement level near that price at 1.3143.
Bottom line
GBP/USD has been grinding sideways in wave 2 since July. A medium term top was reached earlier this week on September 17. Now it appears a strong leg lower has begun that may reach 1.28-1.31.
If Wednesday’s high of 1.3726 is breached, then we’ll reconsider the wave count.
Author

Zorrays Junaid
Alchemy Markets
Zorrays Junaid has extensive combined experience in the financial markets as a portfolio manager and trading coach. More recently, he is an Analyst with Alchemy Markets, and has contributed to DailyFX and Elliott Wave Forecast in the past.