|

GBP/USD Elliott Wave forecast: Buying the dips in the blue box

In this technical article, we are going to talk about another Elliott Wave trading setup we got in GBPUSD. The pair has completed its correction exactly at the Equal Legs zone, also known as the Blue Box Area. In this article, we’ll break down the Elliott Wave forecast, explain the trading setup in detail, and provide the upside target.

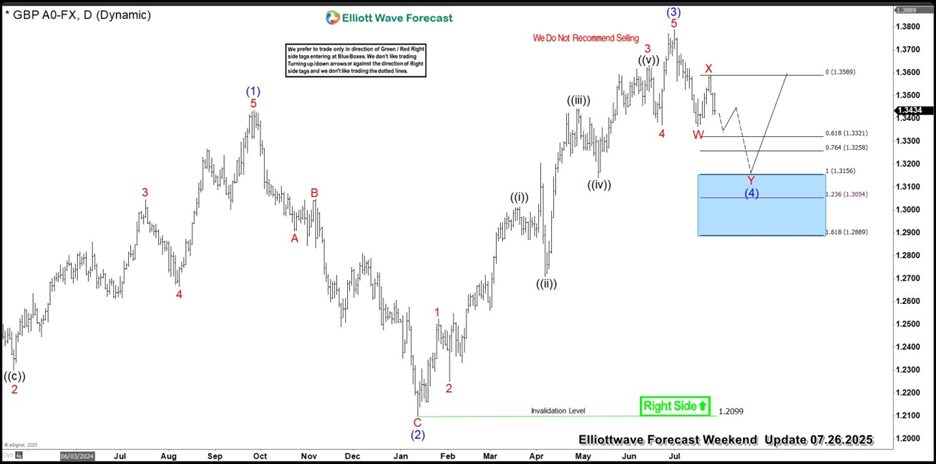
GBP/USD Elliott Wave four-hour chart 07.26.2025

The price action suggests that GBPUSD is forming a pullback in the form of a double three (WXY) structure. While price remains below the red X connector, we believe the correction is still in progress and expect another leg lower toward the 1.3156 area , where we are looking to re-enter as buyers. We recommend that members avoid selling GBPUSD, as the main trend remains bullish. We anticipate at least a three-wave bounce from the Blue Box area.Once the price reaches the 50% Fibonacci retracement against the red X connector, we will make the position risk-free by moving the stop loss to breakeven and booking partial profits.

Chart

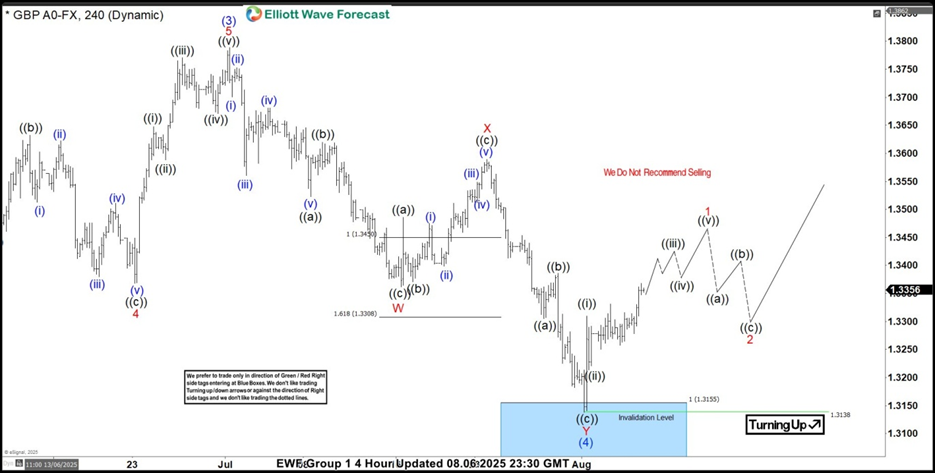
GBP/USD Elliott Wave four hour chart 08.06.2025

The pair has made another wave down and completed 7 swings pattern at the Blue Box area. The pair found buyers as expected, making decent bounce. Reaction from the buying zone has reached 50 fibs against the X red connector. Consequently, any long positions from the Blue Box should now be risk-free. We’ve set our stop loss at breakeven and have already secured partial profits. While price holds above 1.3138, we consider the wave (4) correction complete and see potential for wave (5) to be in progress toward the 1.3936 area.

Chart

Author

Elliott Wave Forecast Team

Elliott Wave Forecast Team

ElliottWave-Forecast.com

More from Elliott Wave Forecast Team
Share:

Editor's Picks

EUR/USD tests nine-day EMA support near 1.1850

EUR/USD inches lower during the Asian hours on Monday, trading around 1.1870 at the time of writing. The 14-day Relative Strength Index momentum indicator at 56 stays above the midline, confirming improving momentum. RSI has cooled from prior overbought readings but stabilizes above 50, suggesting dips could stay limited before buyers reassert control.

GBP/USD flat lines as traders await key UK macro data and FOMC minutes

The GBP/USD pair kicks off a new week on a subdued note and oscillates in a narrow range, just below mid-1.3600s, during the Asian session. Moreover, the mixed fundamental backdrop warrants some caution for aggressive traders as the market focus now shifts to this week's important releases from the UK and the US.

Gold slides below $5,000 amid USD uptick and positive risk tone; downside seems limited

Gold attracts fresh sellers at the start of a new week and reverses a part of Friday's strong move up of over $150 from sub-$4,900 levels. The commodity slides back below the $5,000 psychological mark during the Asian session, though the downside potential seems limited amid a combination of supporting factors.

Bitcoin, Ethereum and Ripple consolidate within key ranges as selling pressure eases

Bitcoin and Ethereum prices have been trading sideways within key ranges following the massive correction. Meanwhile, XRP recovers slightly, breaking above the key resistance zone. The top three cryptocurrencies hint at a potential short-term recovery, with momentum indicators showing fading bearish signs.

Global inflation watch: Signs of cooling services inflation

Realized inflation landed close to expectations in January, as negative base effects weighed on the annual rates. Remaining sticky inflation is largely explained by services, while tariff-driven goods inflation remains limited even in the US.

Ripple Price Forecast: XRP potential bottom could be in sight

Ripple edges up above the intraday low of $1.35 at the time of writing on Friday amid mixed price actions across the crypto market. The remittance token failed to hold support at $1.40 the previous day, reflecting risk-off sentiment amid a decline in retail and institutional sentiment.