GBP/USD Bearish Pullback Bounces at 61.8% Fibonacci

Meta description:
GBP/USD broke above the key resistance trend line, which is indicating a larger bullish breakout from the 23.6% Fib to the 38.2% Fibonacci level at around 1.33.
GBP/USD
4 hour
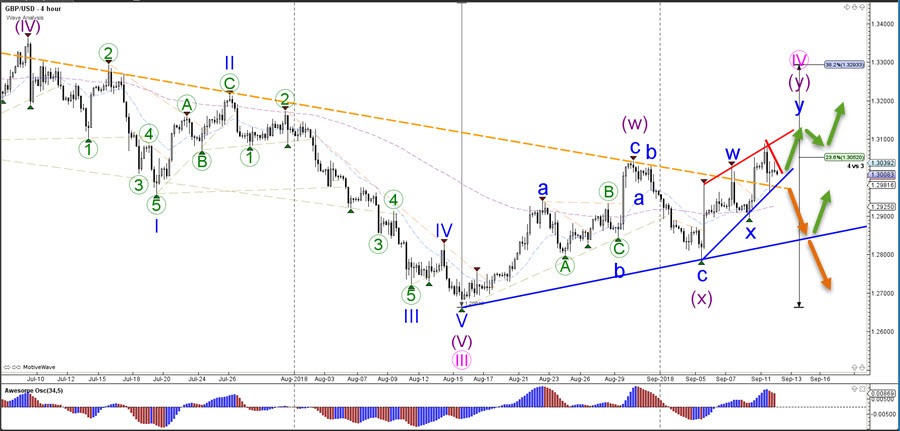
The GBP/USD bullish breakout is showing volatile price action after pushing through the resistance trend line (dotted orange). Price will need to break a next trend line to confirm the direction.
The GBP/USD needs to push above the resistance trend line (red) for a bullish breakout and continuation towards the next 38.2% Fibonacci retracement level at 1.3250-1.33. A bearish breakout could change the likely wave patterns and the completion of waves Y at the recent high is possible.
1 hour
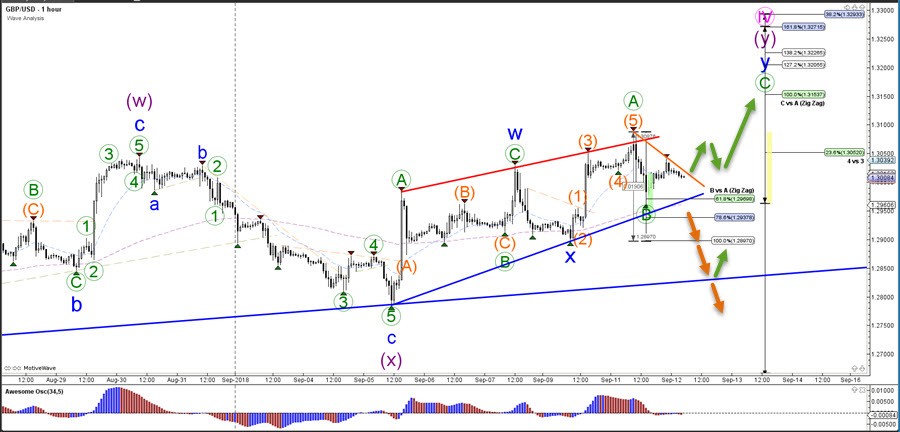
The GBP/USD made a bearish retracement after completing a bullish wave 5 (orange). The pullback could be part of a wave B (green) and price indeed bounced at the 61.8% Fib. The next breakout however remains key.
Author

Chris Svorcik
Elite CurrenSea
Experience Chris Svorcik has co-founded Elite CurrenSea in 2014 together with Nenad Kerkez, aka Tarantula FX. Chris is a technical analyst, wave analyst, trader, writer, educator, webinar speaker, and seminar speaker of the financial markets.


