|

GBP/USD: A false bullish breakout?

  • GBPUSD breaks above bearish channel, faces rejection near 50-SMA.

  • Caution persists among traders as they await a close above 1.2600.

Chart

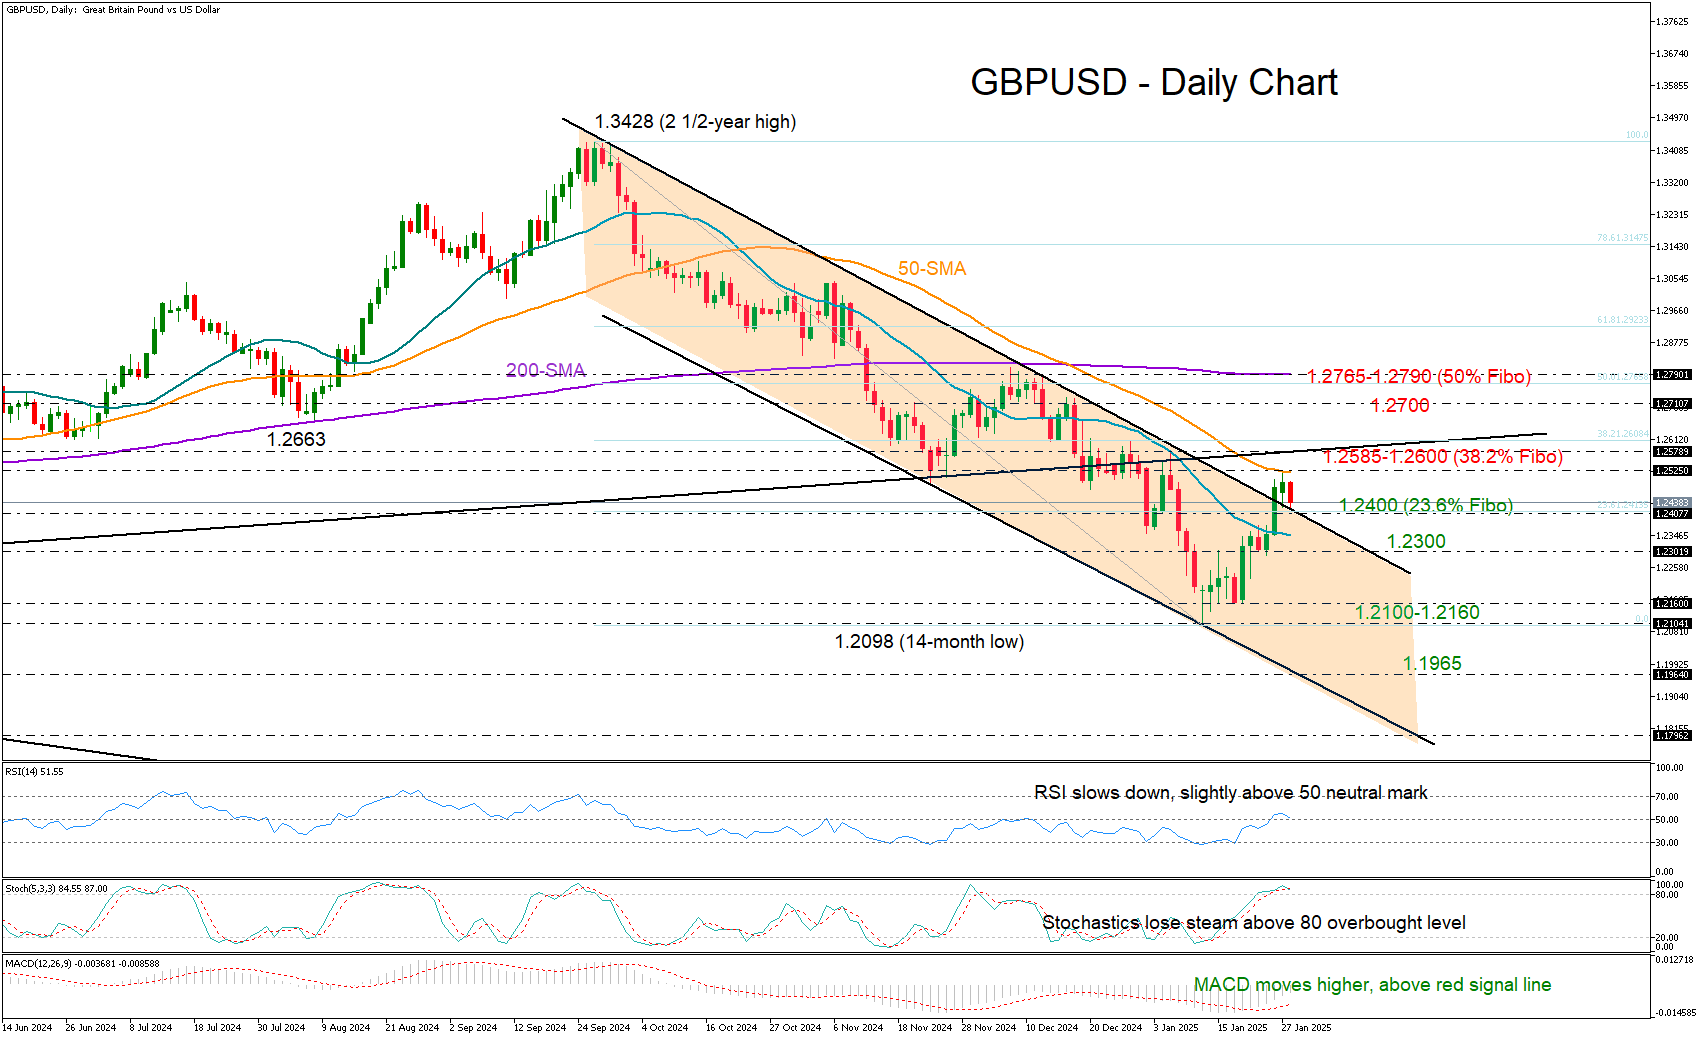
GBPUSD stalled around the falling 50-day simple moving average (SMA) at 1.2525 soon after exiting the bearish channel on the upside. 

Was this a false bullish breakout? No, not as long as the price continues to trade above the channel’s upper boundary seen near 1.2400. The area is currently under examination along with the 23.6% Fibonacci retracement of the latest downtrend. Hence, failure to pivot there could disappoint traders, bringing the 1.2300 round level next into view, while a deeper fall might aim for a bearish extension below the crucial support area of 1.2100-1.2160.

According to the technical indicators, downside risks are still alive. The falling 20- and 50-day SMAs have yet to show any signs of improvement, while the RSI is losing steam marginally above its 50 neutral mark and the stochastic oscillator is set for a negative reversal. 

In the event the pair crosses above its 50-day SMA, the bulls must also jump the wall at 1.2580-1.2600, where the 38.2% Fibonacci mark and the broken support-turned-resistance trendline from March 2023 are sitting. A successful penetration higher could bolster buying appetite, lifting the price swiftly up to the 1.2700 number or even higher to the 50% Fibonacci of 1.2765 and the 200-day SMA at 1.2790.

All in all, GBPUSD moved out of a bearish formation, signaling a potential upward trend reversal. Despite this, the pair has yet to close above the wall of 1.2600, which might be a prerequisite for a major bullish wave

Author

Christina Parthenidou

Christina joined the XM investment research department in May 2017. She holds a master degree in Economics and Business from the Erasmus University Rotterdam with a specialization in International economics.

More from Christina Parthenidou
Share:

Markets move fast. We move first.

Orange Juice Newsletter brings you expert driven insights - not headlines. Every day on your inbox.

By subscribing you agree to our Terms and conditions.

Editor's Picks

EUR/USD flatlines below 1.1800 amid trading lull, awaits Fed Minutes

EUR/USD trades around a flatline below 1.1800 in European trading on Tuesday. The pair lacks any trading impetus as the US Dollar moves little amid market caution ahead of the Fed's December Meeting Minutes release, which could offer insights into the Federal Reserve’s 2026 outlook.

GBP/USD retakes 1.3500 despite the year-end grind

GBP/USD finds fresh demand and retakes 1.3500 on Tuesday as markets grind through the last trading week of the year. Despite the latest uptick, the pair is unlikely to see further progress due to the year-end holiday volumes.

Gold holds the bounce on Fed rate cut bets, safe-haven flows

Gold holds the rebound near $4,350 in the European trading hours on Tuesday. The precious metal recovers some lost ground after falling 4.5% in the previous session, which was Gold's largest single-day loss since October. Increased margin requirements on gold and silver futures by the Chicago Mercantile Exchange Group, one of the world’s largest trading floors for commodities, prompted widespread profit-taking and portfolio rebalancing.

Tron steadies as Justin Sun invests $18 million in Tron Inc.

Tron (TRX) trades above $0.2800 at press time on Monday, hovering below the 50-day Exponential Moving Average (EMA) at $0.2859.

Economic outlook 2026-2027 in advanced countries: Solidity test

After a year marked by global economic resilience and ending on a note of optimism, 2026 looks promising and could be a year of solid economic performance. In our baseline scenario, we expect most of the supportive factors at work in 2025 to continue to play a role in 2026.

Crypto market outlook for 2026

Year 2025 was volatile, as crypto often is.  Among positive catalysts were favourable regulatory changes in the U.S., rise of Digital Asset Treasuries (DAT), adoption of AI and tokenization of Real-World-Assets (RWA).