|

GBP/JPY is nearing strong resistance zone

GBP/JPY has been in a strong bullish phase, but five-wave bullish cycle within wave (5) up from 2022 swing lows can be completed after recent strong reversal down back below channel support lines. In fact, drop from the high is impulsive on a smaller time frame, so it’s wave A that stabilized near 178 support area as expected. As such, current rise is corrective, ideally B wave that can be still in progress as a bigger correction before a continuation lower for wave C. Ideal resistance is at that channel line, from the outside, around 196 – 200 area.
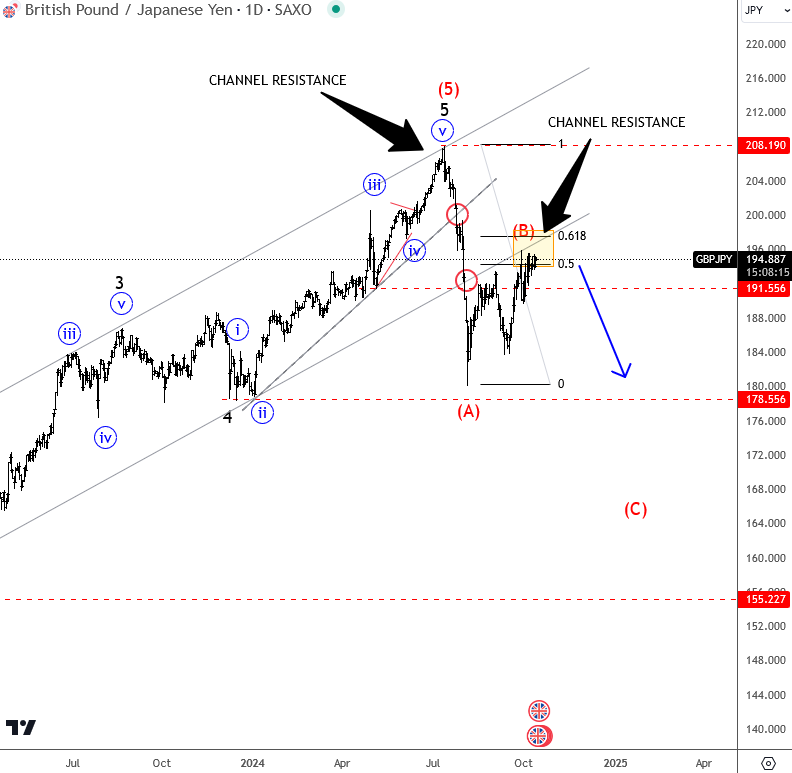
GBPJPY

GBP/JPY daily chart

GBP/JPY is looking for a higher resistance within wave C of (B) in the 4-hour chart, as it can be now breaking out of subwave »iv« triangle into subwave »v« of C, so keep an eye on next strong 196 – 200 resistance zone, from where bears for a higher degree wave (C) may show up.
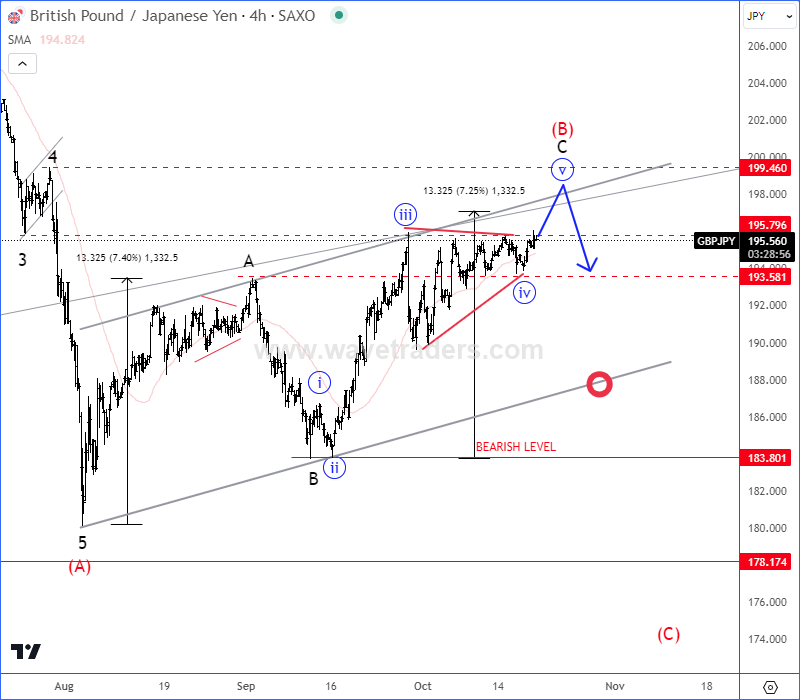
gbpjpy4h

GBP/JPY four-hour chart


Get Full Access To Our Premium Elliott Wave Analysis For 14 Days. Click here.


Get Full Access To Our Premium Elliott Wave Analysis For 14 Days. Click here.

Author

Gregor Horvat

Gregor Horvat

Wavetraders

Experience Grega is based in Slovenia and has been in the Forex market since 2003.

More from Gregor Horvat
Share:

Editor's Picks

AUD/USD sits at two-month lows near 0.6950 after Australian CPI data

AUD/USD is sitting at two-month lows near 0.6950 in the Asian session on Wednesday, as below-expectations August Australian underlying CPI data pours cold water on expectations for further RBA interest rate hikes. Chinese PMI data also fail to inspire the Australian Dollar, despite a pause in the US Dollar advance.

USD/JPY stays weak below 157.00 amid Japanese intervention risks

USD/JPY keeps losses below 157.00 in the Asian session on Wednesday, as hawkish BoJ expectations, along with intervention risks, underpin the Japanese Yen, countering dismal domestic factory output and retail sales data. Meanwhile, a broad US Dollar retreat also collaborates to the pair's downside.

Gold eyes US PCE inflation data for next move

Gold is consolidating the previous rebound from an eight-week low of $4,110 in Asia on Wednesday, although it remains below $4,200 ahead of the US ADP jobs report and core Personal Consumption Expenditures Price Index data.   


Bitcoin, Ethereum, and Ripple pause near recent highs as bullish momentum moderates

Bitcoin, Ethereum, and Ripple are showing signs of slowing bullish momentum mid-week after slight pullbacks from their recent highs. BTC faces resistance near $85,000, with ETH hovering around $2,674 and XRP holding near $1.500, as traders assess whether these top three cryptocurrencies can resume their recent rallies.

Warning: The RBI's October rate hike may be too late as oil risks mount
The Indian Rupee (INR) is one of the worst-performing Asian currencies in 2026, down about 6.5% year-to-date against the US Dollar (USD) and trading near historic lows ahead of the October 5–7 Reserve Bank of India (RBI) meeting. Economists expect the RBI to raise its repo rate by 25 basis points (bps) next month and follow up with another increase in December to counter rising retail inflation.
Silver is more volatile than Gold ahead of PCE and NFP. This chart shows the positioning gap
The market’s attention is focused on American data this week, but there’s something only those with a trained eye may be looking at: Gold and Silver positioning gap. Financial markets are moving on fears, mostly related to persistently high energy prices driven by the Middle East war. Sure, the US Dollar (USD) is strong, but at what cost?