GBP/JPY Elliott Wave technical analysis [Video]
![GBP/JPY Elliott Wave technical analysis [Video]](https://editorial.fxsstatic.com/images/i/gbp-jpy-minimal-01_XtraLarge.jpg)
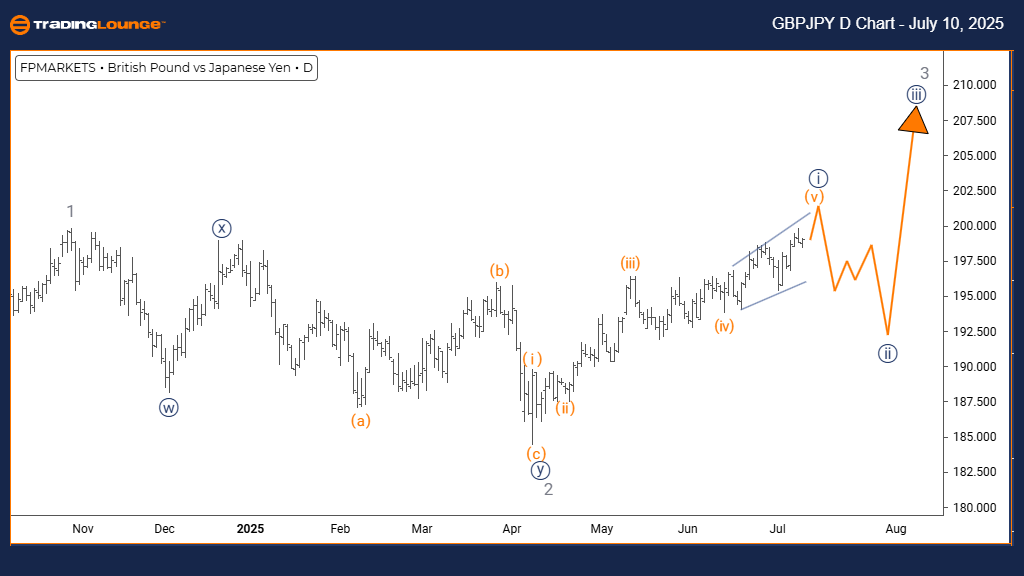
GBP/JPY Elliott Wave technical analysis – Daily chart
Function: Bullish Trend.
Mode: Impulsive.
Structure: Navy Blue Wave 1.
Position: Gray Wave 3.
Direction next lower degrees: Navy Blue Wave 2.
Details: Navy Blue Wave 1 remains active and is nearing its completion.
Daily chart overview
The daily Elliott Wave analysis of GBPJPY indicates a bullish market condition. The pair is currently in Navy Blue Wave 1 within the broader Gray Wave 3 framework, signaling a strong phase of upward momentum. This wave positioning suggests that a corrective Navy Blue Wave 2 is expected after the current impulsive leg completes.
Market data shows Navy Blue Wave 1 is approaching its end, supported by persistent bullish momentum characteristic of Gray Wave 3. As one of the most powerful legs in Elliott Wave sequences, Gray Wave 3 typically features extended gains. Traders should anticipate the near-term end of Wave 1 and prepare for a correction, which could offer renewed entry opportunities in the larger uptrend.
This analysis, rooted in the daily timeframe, reflects broad market sentiment and supports the interpretation of a still-active bullish cycle. With the wave structure indicating further potential after correction, this phase provides a strategic view of future price movements and key opportunities.
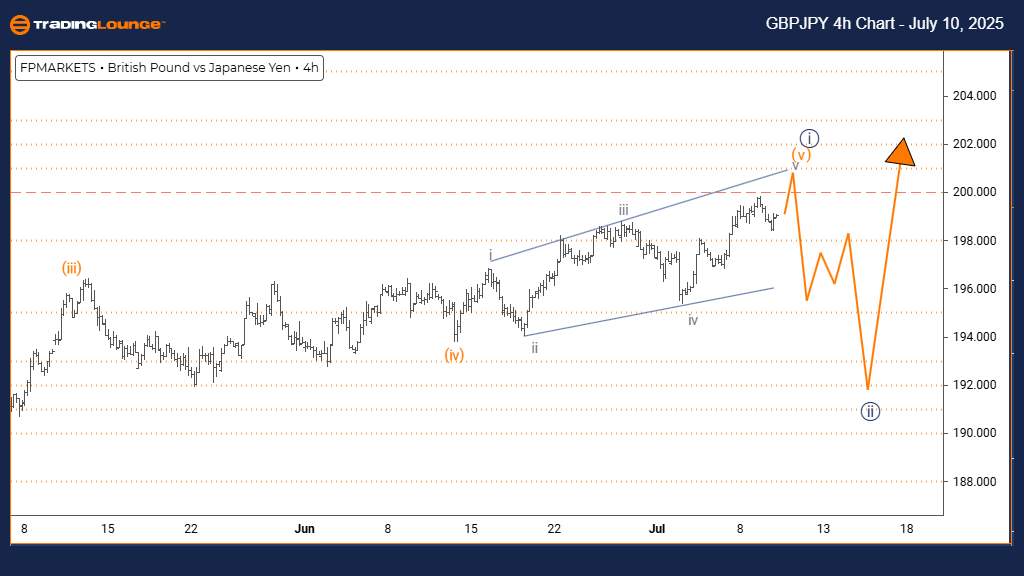
GBP/JPY Elliott Wave technical analysis – Four-hour chart
Function: Bullish Trend.
Mode: Impulsive.
Structure: Orange Wave 5.
Position: Navy Blue Wave 1.
Direction next lower degrees: Navy Blue Wave 2.
Details: Orange Wave 4 seems complete; Orange Wave 5 is currently developing.
Four-hour chart insight
In the 4-hour view, GBPJPY continues its bullish advance, now progressing through Orange Wave 5 within Navy Blue Wave 1. This phase generally represents the final leg of an impulsive wave before transitioning into a corrective pullback, identified here as the pending Navy Blue Wave 2.
The completion of Orange Wave 4 has laid the groundwork for the final push of this wave cycle. Orange Wave 5’s current extension highlights continued buying strength, although traders should remain cautious and watch for exhaustion or reversal signs as the wave matures.
The 4-hour chart provides short- to medium-term traders with a strategic look at potential near-term turning points. Monitoring for divergence or declining momentum will be key in managing risk during this final wave sequence. This setup offers structured insight into how price may behave as the current bullish cycle nears a potential pivot.
GBP/JPY Elliott Wave technical analysis [Video]
Author

Peter Mathers
TradingLounge
Peter Mathers started actively trading in 1982. He began his career at Hoei and Shoin, a Japanese futures trading company.


